Abstract
Codon usage tends to be optimized in highly expressed genes. A plausible explanation for this phenomenon is that translational accuracy is increased in highly expressed genes with infrequent use of rare codons. Besides structural domains (SDs), eukaryotic proteins generally have intrinsically disordered regions (IDRs) that by themselves do not assume unique three-dimensional structures. As IDRs are free from structural constraint, they can probably accommodate more translational errors than SDs can. Thus, codon usage in IDRs is likely to be less optimized than that in SDs. Codon usage in all the genes of seven eukaryotes was examined in terms of both tRNA adaptation index and codon adaptation index. Different amino acid compositions in different protein regions were taken into account in calculating expected adaptation indices, to which observed indices were compared. Codon usage is less optimized in gene regions encoding IDRs than in those corresponding to SDs. The finding does not depend on whether IDRs are located at the N-terminus, in the middle, or at the C-terminus of proteins. Furthermore, the observation remains unchanged in two different algorithms used to predict IDRs in proteins. The result is consistent with the idea that IDRs tolerate more translational errors than SDs.
INTRODUCTION
Synonymous codons are used at different frequencies in genomes and highly expressed genes tend to use codons that match abundant isoaccepting tRNAs in the cell (1,2). The translational efficiency hypothesis postulates that preferentially used codons are translated faster because the cognate tRNAs have higher cellular concentrations and vice versa. Recently developed ribosome profiling (3) provides ribosome density distribution data and thereby gives an experimental test for this hypothesis, as ribosome density is inversely proportional to translational speed. Data analyses of ribosome profiling data of Mus musculus and Saccharomyces cerevisiae revealed that codon usage bias is unrelated to translation speed (4–6). By contrast the translational accuracy hypothesis proposes that preferred codons are translated more accurately than rare codons. This hypothesis is supported by several studies (7–10). However, the controversy has not been fully resolved, as evidence against the translational accuracy hypothesis exists (11).
Codon adaptation index (CAI) calculates the usage frequency of each codon in the genome and computes the geometric mean of usage frequency in each protein (12). CAI first calculates the relative adaptation index (wj) of each codon as the usage frequency divided by that of the most frequently used codon of the amino acid and then computes the geometric average of wjs. Codon bias can alternatively be quantified with the use of tRNA abundances. Although cellular tRNA concentrations are unknown in most species, they are mostly proportional to tRNA gene copy numbers in several species examined (1,13–15). Based on this observation, tRNA adaptation index (tAI) calculates codon bias using the genome copy numbers of tRNAs (16): this method defines the relative adaptation index (wj) of each codon as the number of matching tRNAs divided by that of maximum number of tRNAs for all codons and calculates the geometric mean of wj for each protein.
Eukaryotic proteins generally consist of structural domains (SDs) and intrinsically disordered regions (IDRs), long stretches of amino acids that are either unfolded in solution or adopt non-globular structures of unknown conformation (17,18). While neutral polymorphisms more likely occur in IDRs, cancer-associated mutations preferentially fall in SDs (19), presumably because mutations in IDRs tend not affect functions. We surmised that IDRs tolerate more translational errors than SDs as the former are generally free from structural constraints. If that is true, codon usage in gene segments encoding IDRs is predicted to be less optimized than those encoding SDs, assuming that the translational accuracy hypothesis is true. To test this idea, we chose seven entirely sequenced eukaryotes, divided all the encoded proteins into SDs and IDRs, and analyzed the codon usage bias in terms of tAI in gene segments encoding SDs and IDRs. The results show that gene segments encoding IDRs tend to have lower tAI than those corresponding to SDs, i.e. the former are less optimized in codon usage than the latter. As translation errors in IDRs are probably more tolerable than those in SDs, this result supports the translational accuracy hypothesis.
MATERIALS AND METHODS
All the sequence data used in this study were taken from the GTOP database (20) (2009 version), the genome copy numbers of tRNAs in each species were obtained from the Genomic tRNA database (Apr. 16, 2011 version) (21), and the codon usage frequencies in each species came from the Codon Usage Database (Release 160.0) (22). All the presented variations in means are standard errors of the mean. Proteins were divided into SDs and IDRs either by the DICHOT (23) or POODLE-L (24). DICHOT has been written to identify IDRs longer than 30 amino acid residues, while POODLE-L does not have a minimum length requirement for IDRs. With the exception of proteins that consist entirely of SDs or IDRs, the SDs were divided into the first half (SN) and the latter half (SC) and the distance from the nearest IDR border of each residue is computed, while the IDRs were similarly classified into the first half (DN) and the latter half (DC) regions and the distance from the nearest SD border of each amino acid is computed (Figure 1A). Unless otherwise noted, all-SD and all-IDR proteins were excluded from analyses as they have no IDR/SD borders. Each residue in IDRs of yeast proteins was classified into constrained, flexible and non-conserved by the reported method (25) with the modification that IDRs were predicted by DICHOT or POODLE-L.
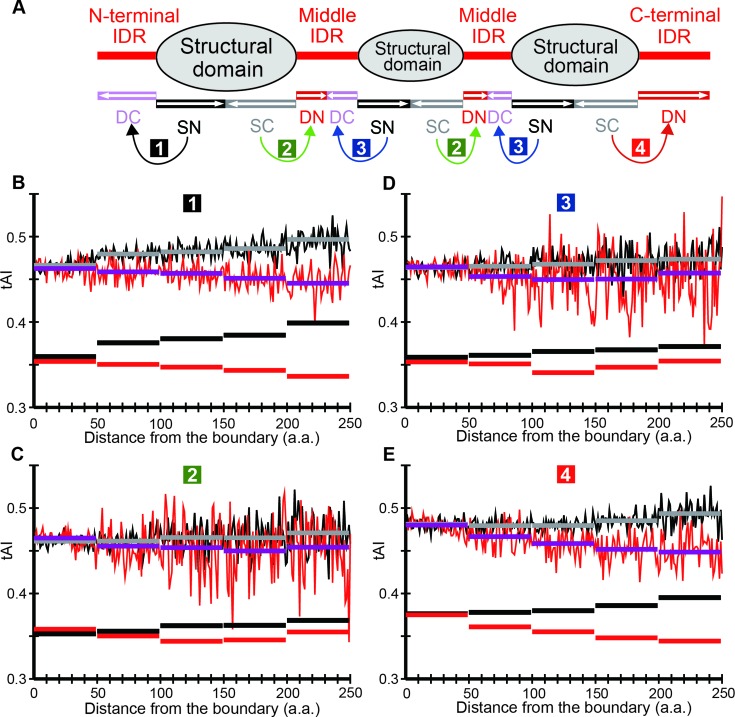
Figure 1.
How tAI means are calculated in the case of S. cerevisiae. (A) How proteins are divided into intrinsically disordered regions (IDRs) and structural domains (SDs) and sub-classified according to their locations. Curved arrows indicate the pairs of IDR and SD sections for comparing distributions of mean tAI. (B) Comparison of the tAI mean distributions of N-terminal IDRs with contiguous SDs. (C) Comparison of the tAI mean distributions of the first half of middle IDRs with contiguous SDs. (D) Comparison of the tAI mean distributions of the latter half of middle IDRs with contiguous SDs. (E) Comparison of the tAI mean distributions of C-terminal IDRs with contiguous SDs. (B–E) The fluctuating red and black lines respectively represent tAIs in SDs and IDRs. The arithmetic means of each distance bin (1∼49, 50∼99, 100∼149, 150∼149 and 150∼ amino acid residues from the nearest IDR/SD boundary) for IDR and SD sections are indicated by magenta and grey horizontal bars, respectively, while the corresponding geometric means are shown in red and black horizontal rectangles.
The expected mean tAI and CAI of IDRs were calculated as follows: (i) the geometric means of tAI and CAI values of each amino acid in SDs were computed in the SN and SC regions in each pair in Figure 1A, (ii) the frequencies of amino acids in the IDR section under investigation were determined, (iii) assuming the mean values in SDs obtained in (i) as the tAI and CAI values of each amino acid in IDRs, the expected tAI and CAI values in the IDR section were calculated using the amino acid frequencies obtained in (ii). If we calculate the expected geometric means of tAI and CAI in SDs in the same way as we compute those in IDRs, they are mathematically equal to 1: the geometric mean of the wjs of each residue is the same even if the wjs of each amino acid are first pooled before averaging. For instance, consider a hypothetical four-residue SD encoded by w1= 0.4, w2= 0.3, w3= 0.6 and w4= 0.5, with w1 and w3 encoding amino acid A, while w2 and w4 encoding amino acid B. The geometric mean is (0.4 × 0.3 × 0.6 × 0.5)1/4 ≈ 0.435. (In comparison, the arithmetic mean of this region is 0.45. The geometric mean of tAI and CAI is generally lower than the arithmetic mean as wjs are less than or equal to 1.) The geometric mean of amino acids A and B are (0.4 × 0.6)1/2 ≈ 0.490 and (0.3 × 0.5)1/2 ≈ 0.387, respectively. The expected tAI of this region is (0.490 × 0.387 × 0.490 × 0.387)1/4 ≈ 0.435, agreeing with the observed geometric mean. The expected mean of a hypothetical three-residue IDR of the sequence BAB is (0.387 × 0.490 × 0.387)1/3 ≈ 0.419.
RESULTS
Observed tAI values of S. cerevisiae proteins using DICHOT assignments
We first divided all the proteins in S. cerevisiae into SDs and IDRs by the DICHOT program (Figure 1A) and computed the tAIs of codons encoding SDs and IDRs. Calculations revealed that ‘mean tAI’ (defined as the arithmetic mean of wj) of gene regions encoding IDRs is lower than that of regions encoding SDs (0.4617 ± 0.0003 versus 0.4739 ± 0.0002; significantly different at P < 10−40 by the two-sided t-test). For brevity we refer to them as the mean tAIs of IDRs and SDs. This result indicates that codon usage is on average less optimized in those encoding IDRs than in those corresponding to SDs. In order to check whether the phenomenon depends on IDR locations in proteins, we classified IDRs into N-terminal, middle and C-terminal IDRs and see whether the mean tAI of IDRs in each location is lower than that of the contiguous SDs. This signifies that the mean tAIs of the four pairs (labeled 1–4 in outline letters in colored backgrounds in the figure) of IDR and SD sections are compared. We also determined the dependence of mean tAI on the distance from the nearest SD/IDR boundary. To find the dependence of mean tAI on the distance from the nearest SD/IDR boundary, we subdivided all the SDs and middle IDRs into the N-terminal and C-terminal halves. We computed the mean tAI of IDR and SD at each distance from the nearest SD/IDR boundary in each IDR and SD section.
We plotted the distributions of each pair in Figure 1A; those of pair 1, i.e. N-terminal IDRs and the contiguous SDs (Figure 1B), those of pair 2, i.e. those of the first half of middle IDRs and the contiguous SDs (Figure 1C), those of pair 3, i.e. the latter half of middle IDRs and of the contiguous SDs (Figure 1D), and pair 4, i.e. those of the C-terminal IDRs and of the contiguous SDs (Figure 1E).
In all pairs, tAI of IDRs (red fluctuating lines) is generally lower than that of SDs (black fluctuating lines). This observation shows that the codon usage in IDRs is less optimized than in SDs, irrespective of the location of IDRs within proteins. Moreover, as the distance from the SD/IDR boundary increases, mean tAI of IDRs apparently decreases, while that of contiguous SDs appears to increase. These trends can be more easily perceived from the mean tAI averaged over ∼50 residue bins (horizontal lines in the figure). Note that geometric means (red and black horizontal bars for IDRs and SDs, respectively) are lower than arithmetic means (grey and magenta rectangles) as wjs are less than or equal to 1. Following the published procedures, geometric means will be used in the following.
This apparently means that codon usage in IDRs becomes less and less optimized as we move away from the boundary with SDs, while that in SDs is increasingly optimized with increasing distance from the IDR boundary. However, it is conceivable that predicted SD/IDR borders are sometimes imprecise and predicted SDs near the borders contain some IDRs and vice versa. Frequent erroneous border identifications can result in nearly identical tAI values in SDs and IDRs in regions close to the predicted border even if the actual tAI values in IDRs may be invariably lower than those in SDs. Thus, it is possible that the codon usage in IDRs is constantly less optimized than that in SDs, but some erroneous SD/IDR border predictions give rise to the observed slopes.
Observed tAI means of eukaryotic protein regions using DICHOT assignments
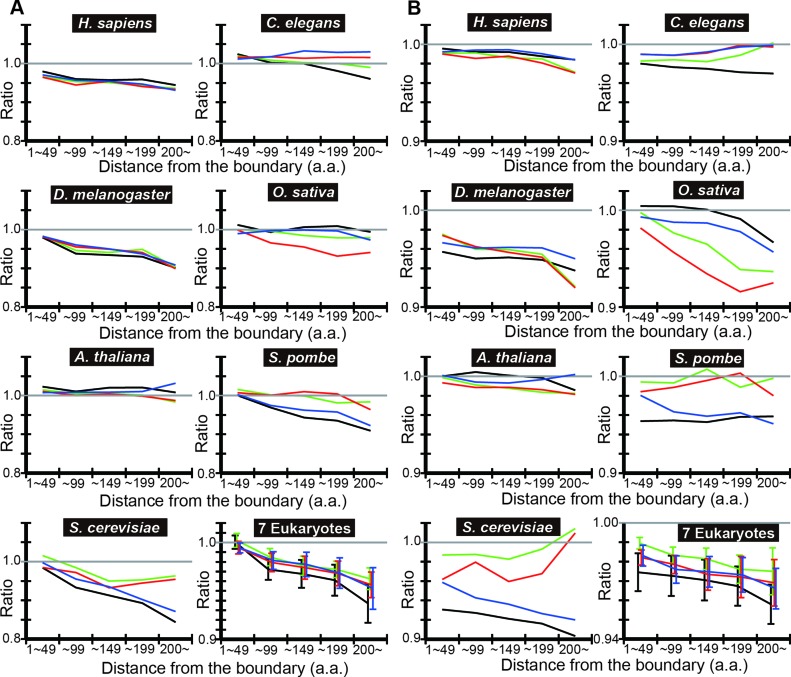
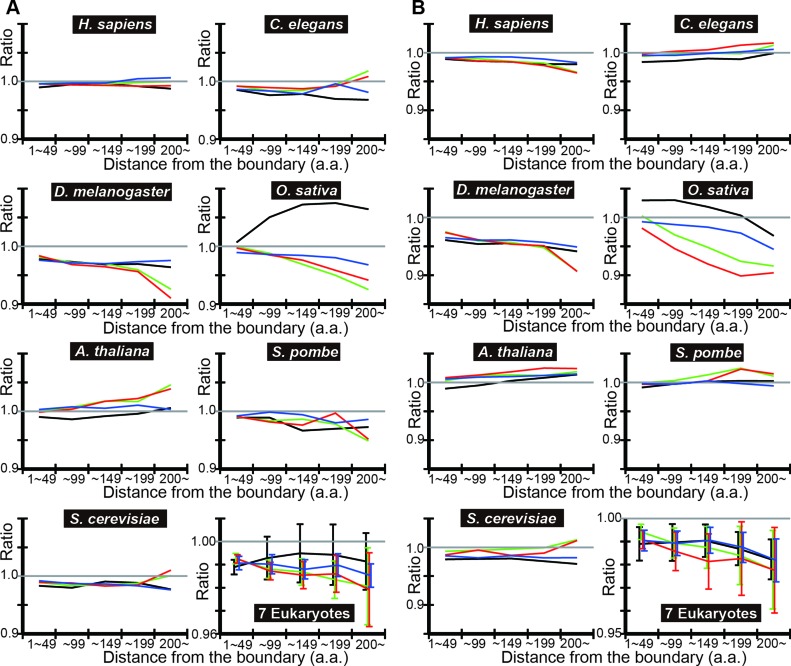
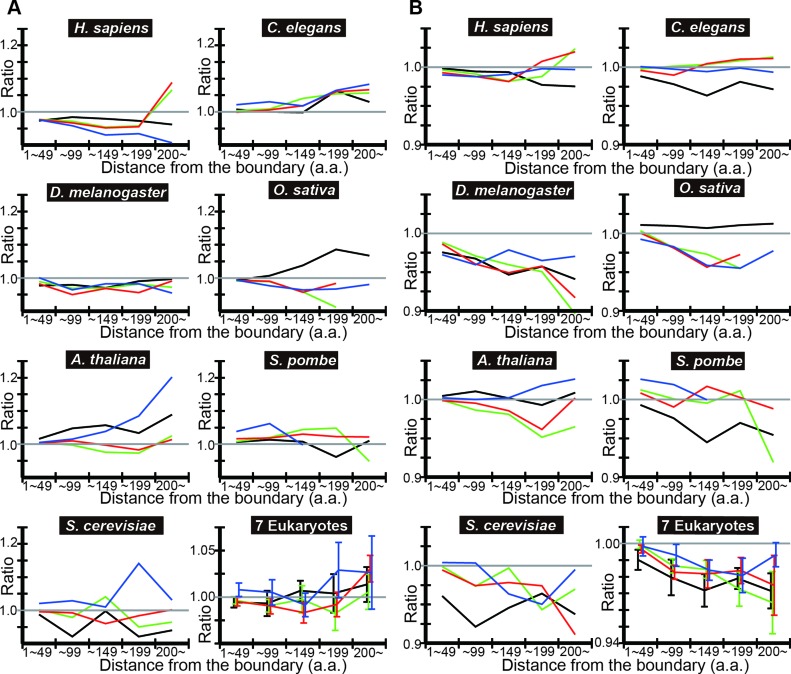
To test the generality of the findings, we carried out the same analyses in six other eukaryotes: Homo sapience, Caenorhabditis elegans, Drosophila melanogaster, Oryza sativa, Arabidopsis thaliana and Schizosaccharomyces pombe. We plotted the ratio of the mean tAI of IDRs in each distance bin to the mean tAI of the contiguous SDs of the corresponding distance bin (‘observed ratio’ of tAI means) (Figure 2A). In most cases, the ratio shows a decreasing trend with distance from the nearest SD/IDR boundary.
Figure 2.
DICHOT analyses of tAI means show that the codon usage in IDRs is less optimized than that in SDs. (A) The observed ratio of IDR to SD according to DICHOT. In each distance bin, the ratio of mean tAI of in N-terminal IDRs to contiguous SDs in pairs 1–4 of Figure 1A is computed using DICHOT results and graphed in black, green, red and blue, respectively. The arithmetic mean of the ratios of the seven species is computed in each bin and plotted with error bars representing the standard errors of the mean (SEM) as ‘7 Eukaryotes’. (B) The observed-to-expected ratios of IDR according to DICHOT. The ratios are plotted as in (A).
tAI analyses with corrections for amino acid composition
However, the mean tAI in IDRs cannot simply be compared with that in contiguous SDs as amino acid compositions of IDRs and SDs differ. For instance, proline is encoded by four codons, has the mean of the four wjs lower than the mean of all wjs in S. cerevisiae, and is used more frequently in IDRs than in SDs, tending to lower the observed mean tAI in IDRs. We thus made corrections for the amino acid composition differences and computed the expected mean tAI. More precisely, we calculated the expected mean tAI of IDRs in each distance bin, assuming the mean wj of each amino acid in SDs to be the wj of the amino acid in the IDRs. In the given example, proline residues in IDRs were all assumed to have the weighted mean value of wjs of the four codons encoding proline residues in SDs.
We then calculated the expected mean tAI in each distance bin and plotted the ratio of the observed mean tAI to the expected mean tAI (‘observed-to-expected ratio’ of tAI means) (Figure 2B). In almost all cases, the ratio is less than one and shows a decreasing trend, indicating that codon usage in IDRs is less optimized than in SDs in eukaryotes after corrections for the amino acid composition differences and the difference becomes more pronounced in regions further away from the boundary. We note that expected values cannot be accurately calculated in regions with small total numbers of residues as the amino acid compositions of the regions show statistical fluctuations. Since long SDs and IDRs are rare, distance bins further away from the boundary tend to contain smaller total number of residues especially in yeast species that have fewer proteins than the other five eukaryotes, introducing more uncertainties in the expected ratios. Taking this inaccuracy into consideration, it is probable that the observed-to-expected ratio generally decreases with distance from the boundary.
tAI analyses using POODLE-L assignments
To check if the results hold with a different IDR prediction algorithm, we repeated the same analyses using POODLE-L in place of DICHOT to compute the observed ratio (Figure 3A) and the observed-to-expected ratio (Figure 3B) in each distance bin. Most of the observed-to-expected ratios are less than one and exhibit decreasing trends just as those obtained with DICHOT, indicating the independence of the results on IDR prediction algorithms.
Figure 3.
POODLE-L analyses of tAI means also show that the codon usage in IDRs is less optimized than that in SDs in most cases. (A) and (B) were drawn exactly as in Figure 2 except that SD and IDR assignments were made by POODLE-L instead of DICHOT.
CAI analyses
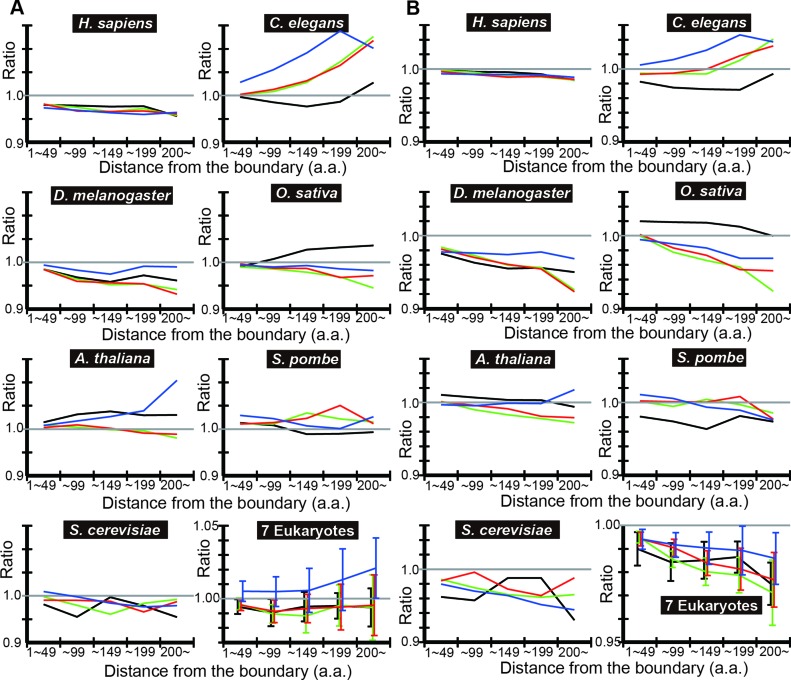
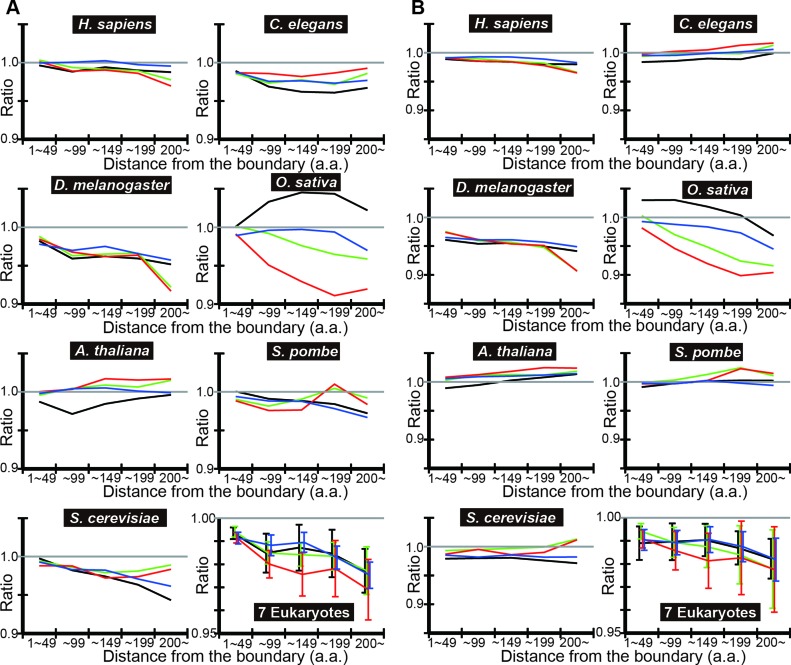
Besides tAI, CAI is frequently used as a measure of codon usage bias. Accuracy in translation is likely to depend on tRNA concentrations on which tAI calculations are based, but not directly on codon usage frequency on which CAI calculations are based; codons with high concentrations of exactly matching tRNAs are accurately translated and vice versa. We thus expect the difference in codon optimization between IDRs and SDs to be less pronounced if CAI instead of tAI is used for codon bias analyses. To test this, we repeated the codon bias analyses using CAI, with both DICHOT and POODLE-L algorithms (Figures 4 and 5). Although the observed-to-expected ratios on average are less than one and tend to decrease with the distance from the boundary, a number of exceptions are apparent in individual species (Figures 4B and 5B). Thus, CAI analyses generally indicate less codon optimization in IDRs than in SDs just as tAI analyses do, but with more exceptions. We consider the weaker results with CAI analyses consistent with the translation accuracy hypothesis.
Figure 4.
CAI means of IDRs and SDs using DICHOT results. The geometric means of CAI in each species and the overall means of the seven eukaryotes were computed and graphed as in Figure 2.
Figure 5.
CAI means of IDRs and SDs using POODLE-L results. The geometric means of CAI in each species and the overall means of the seven eukaryotes were calculated and plotted as in Figure 2.
Classification of IDRs by conservation
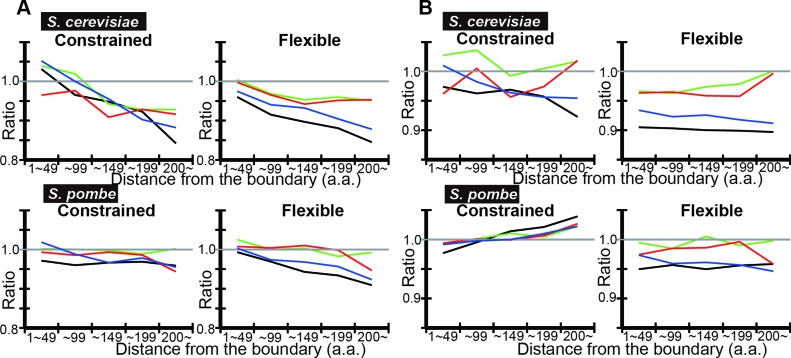
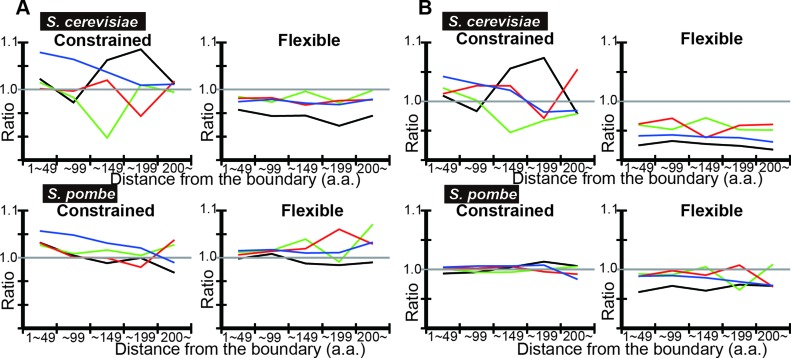
IDRs of yeast proteins were classified into regions where disorder is evolutionarily conserved with quickly evolving amino acid sequences (flexible disorder), those with evolutionarily conserved disorder with highly conserved amino acid sequences (constrained disorder), and those with poor evolutionary conservation of disorder (non-conserved disorder) were shown to have distinct functions (25). We investigated if codon optimization in IDRs may differ in the three classes. Using DICHOT, we calculated the tAI means in each region with classified IDRs of yeast proteins (Figure 6). As the number of residues in each bin in non-conserved disorder was too small to give statistically significant results, we did not plot the corresponding data. Flexible disorder generally shows lower observed-to-expected ratios than constrained disorder does (Figure 6B). To test the dependence on IDR prediction algorithms, we repeated the same analyses using POODLE-L (Figure 7). The same difference in the observed-to-expected ratios between flexible disorder and constrained disorder is observed, demonstrating robustness of results against IDR prediction algorithms (Figure 7B).
Figure 6.
DICHOT analyses of tAI means show that flexible IDRs tend to have lower tAI than constrained IDRs. Analyses of S. cerevisiae and S. pombe proteins were carried out as in Figure 2, but with classification of each residue in IDRs into constrained, flexible and non-conserved disorder. The plots are as in Figure 2 except that they are terminated once the number of residues in IDRs falls below 1000.
Figure 7.
POODLE-L analyses of tAI means also show that flexible IDRs tend to have lower tAI than constrained IDRs. Analyses of S. cerevisiae and S. pombe proteins were carried out and the results are presented as in Figure 3, but with classification of each residue in IDRs into constrained, flexible and non-conserved disorder. The plots are terminated as in Figure 6.
Effects of protein expression
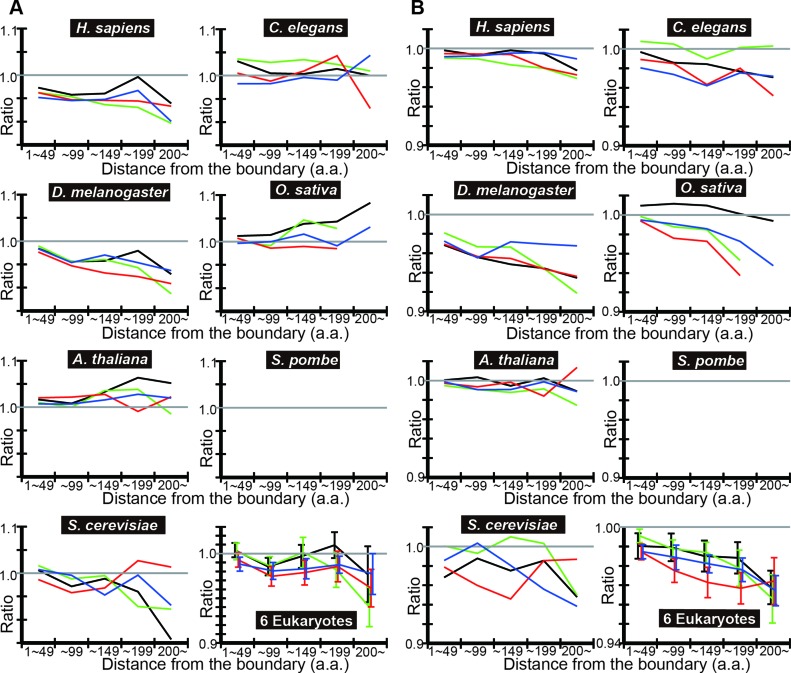
Proteins rich in IDRs tend to be expressed in lower amounts and are dosage sensitive (26). As the codons of less expressed proteins tend to be less optimized (1,2), the codons in IDRs of proteins rich in IDRs are likely to be less optimized. Does this presumed trend explain the current finding that IDRs are less codon-optimized than SDs? That is, can the reduced codon optimization in all residues of IDR-rich proteins explain the phenomenon? To test this possibility, we selected proteins approximately half of which consist of IDRs. Such proteins are generally expressed at low levels and express IDRs and SDs to nearly the same extent. DICHOT and POODL-L analyses (Figures 8 and 9) resulted in nearly the same slopes in expected-to-observed ratios in IDRs as those of all proteins, although the reduced sample numbers probably resulted in more fluctuations than those of all proteins (Figures 2 and 3). That is, the codons in IDRs in IDR-rich proteins are less optimized to the same extent at those in all proteins. The results thus do not support the notion that the reduced optimization in IDRs is attributable to those in proteins rich in IDRs.
Figure 8.
Proteins approximately half of which consist of IDRs also show lower tAI in IDRs by DICHOT analyses. The same analyses as in Figure 2 were carried out with proteins that contain IDRs between 45% and 55% and presented as in Figure 2 except that the ratios for which either the number of residues in SDs or in IDRs was less than 100 were omitted. No data in S. pombe passed the number criterion.
Figure 9.
Proteins approximately half of which consist of IDRs also show lower tAI in IDRs by POODLE-L analyses. The same analyses as in Figure 8 were carried out with POODLE-L instead of DICHOT algorithm and are shown as in Figure 8.
DISCUSSION
We found that codon usage appears less and less optimized in IDRs as the distance from the SD boundary increases. The downward trend, however, may be a result of errors in identifying the SD-IDR boundaries: predicted IDRs sections close to the boundary with SDs may erroneously contain SDs, and predicted SDs near the boundary may have some mistakenly identified IDRs, giving rise to near equality of codon bias in IDRs and SDs at small distance from the boundary. Irrespective of possible misidentification of some IDRs and SDs, codon adaption in IDRs is probably less optimized than in SDs. This observation is consistent with the translational accuracy hypothesis; IDRs have their codon usage less optimized probably because they tolerate more translational errors than SDs.
Analyses of IDRs of different conservation classes revealed that flexible disorder shows reduced codon optimization than constrained disorder does. This indicates that flexible disorder tolerates even more translational errors than constrained disorder does. Flexible disorder is reportedly associated with signaling pathways and multi-functionality, while constrained disorder is involved in RNA binding and protein chaperones (25). The current finding implies that proteins involved in the latter functions tend to be less error-tolerant than those in the former functions.
Thus far we excluded IDRs in all-IDR proteins from analyses as they cannot be unambiguously sub-classified into N-terminal, middle, or C-terminal IDRs. To see whether the codons of such proteins are also less optimized, however, we regarded them as middle IDRs and analyzed in comparison with the middle SDs in all proteins and computed the expected-to-observed ratios of tAI means (Supplementary Figures S1 and S2). In contrast to IDRs of other proteins, the IDRs of all-IDR proteins do not clearly show reduced codon optimization. As the expression levels of such proteins are generally low (26), this observation again supports the view that IDRs in IDR-rich proteins do not account for the reduced codon optimization in IDRs.
Does the result that codon usage is less optimized in IDRs depend on the lengths of IDRs? DICHOT has been written to identify IDRs longer than 30 amino acid residues, while POODLE-L does not have a minimum length requirement for IDRs. The general agreement of DICHOT and POODLE-L results (Figures 2 and 3) indicates that the exclusion or inclusion of short IDRs does not affect the result. Analyses with IDRs classified into different length ranges also showed the independence of the result on IDR lengths.
At first sight, less codon optimization in IDRs than SDs does not support the translational efficiency hypothesis. That is, if more codon optimization in SDs signifies faster translation, the regions are given less time to fold into correct structures, while IDRs that do not form structures are translated more slowly. However, as the nascent chain of ∼36 amino acid residues in the ribosome tunnel does not assume three-dimensional structures (27), there is a delay between translation of a codon and protein structure formation. To rigorously test the translational efficiency hypothesis, we therefore need to analyze correlation between codon usage and protein structure with a 36-residue offset. Recalculations with the offset using DICHOT (Supplementary Figure S3) and POODLE-L (Supplementary Figure S4) gave nearly identical results as those obtained without offset (Figures 2 and 3). Thus, the current findings do not support the translational efficiency hypothesis.
Moreover, our preliminary analysis of ribosome profiling data of S. cerevisiae (3) showed that the mean ribosome density of gene sections encoding IDRs is significantly lower than that encoding SDs. This indicates that gene sections encoding IDRs are on average translated faster than those corresponding to SDs. Considering the current finding that tAI is generally lower in gene sections encoding IDRs than those encoding SDs, we conclude that translation speed is not significantly dependent on codon adaptation bias, in agreement with previous reports (4–6).
Although the present findings are consistent with the tolerance of translation errors in IDRs, they do not exclude other interpretations. Elements that function at the nucleotide level preferentially encode IDRs (28) and thereby affect codon usage in IDRs. Possibly the codons in IDRs cannot be optimized so as to maintain such nucleotide-level functions. In support of this idea, codons in the terminal regions of exons in D. melanogaster were found to be less optimized than the central regions to ensure accurate splicing (29) and exon boundaries preferentially encode IDRs (28,30,31). If this is true, the codons encoding elements in IDRs that are known to function at the nucleotide level are predicted to be less optimized than those encoding the rest of IDRs. Furthermore, protein expansion is primarily due to IDRs and not SDs (32). As IDRs thus tend to arise later than SDs in protein evolution, their codons may not have had sufficient time to optimize. This idea entails that the codons of IDRs that arose more recently tend to be less optimized than more ancient IDRs. More research is needed to distinguish these possibilities.
Supplementary Material
Acknowledgments
The authors would like to thank Mr. S. Sakamoto for updating and maintaining the GTOP database.
SUPPLEMENTARY DATA
Supplementary Data are available at NAR Online.
FUNDING
Scientific research on innovative areas, ‘Target recognition and expression mechanism of intrinsically disordered proteins’; ‘Platform for Drug Discovery, Informatics and Structural Life Science’ from the Ministry of Education, Culture, Sports, Science and Technology of Japan (MEXT) and Japan Agency for Medical Research and Development (AMED). Funding for open access charge: Ministry of Education, Culture, Sports, Science and Technology of Japan.
Conflict of interest statement. None declared.
REFERENCES
- 1.Ikemura T. Correlation between the abundance of Escherichia coli transfer RNAs and the occurrence of the respective codons in its protein genes. J. Mol. Biol. 1981;145:1–21. doi: 10.1016/0022-2836(81)90363-6. [DOI] [PubMed] [Google Scholar]
- 2.Ikemura T. Codon usage and tRNA content in unicellular and multicellular organisms. Mol. Biol. Evol. 1985;2:13–34. doi: 10.1093/oxfordjournals.molbev.a040335. [DOI] [PubMed] [Google Scholar]
- 3.Ingolia N.T., Ghaemmaghami S., Newman J.R., Weissman J.S. Genome-wide analysis in vivo of translation with nucleotide resolution using ribosome profiling. Science. 2009;324:218–223. doi: 10.1126/science.1168978. [DOI] [PMC free article] [PubMed] [Google Scholar]
- 4.Ingolia N.T., Lareau L.F., Weissman J.S. Ribosome profiling of mouse embryonic stem cells reveals the complexity and dynamics of mammalian proteomes. Cell. 2011;147:789–802. doi: 10.1016/j.cell.2011.10.002. [DOI] [PMC free article] [PubMed] [Google Scholar]
- 5.Qian W., Yang J.R., Pearson N.M., Maclean C., Zhang J. Balanced codon usage optimizes eukaryotic translational efficiency. PLoS Genet. 2012;8:e1002603. doi: 10.1371/journal.pgen.1002603. [DOI] [PMC free article] [PubMed] [Google Scholar]
- 6.Charneski C.A., Hurst L.D. Positively charged residues are the major determinants of ribosomal velocity. PLoS Biol. 2013;11:e1001508. doi: 10.1371/journal.pbio.1001508. [DOI] [PMC free article] [PubMed] [Google Scholar]
- 7.Akashi H. Synonymous codon usage in Drosophila melanogaster: natural selection and translationalaccuracy. Genetics. 1994;136:927–935. doi: 10.1093/genetics/136.3.927. [DOI] [PMC free article] [PubMed] [Google Scholar]
- 8.Stoletzki N., Eyre-Walker A. Synonymous codon usage in Escherichia coli: selection for translational accuracy. Mol. Biol. Evol. 2007;24:374–381. doi: 10.1093/molbev/msl166. [DOI] [PubMed] [Google Scholar]
- 9.Drummond D.A., Wilke C.O. Mistranslation-induced protein misfolding as a dominant constraint on coding-sequence evolution. Cell. 2008;134:341–352. doi: 10.1016/j.cell.2008.05.042. [DOI] [PMC free article] [PubMed] [Google Scholar]
- 10.Zhou T., Weems M., Wilke C.O. Translationally optimal codons associate with structurally sensitive sites in proteins. Mol. Biol. Evol. 2009;26:1571–1580. doi: 10.1093/molbev/msp070. [DOI] [PMC free article] [PubMed] [Google Scholar]
- 11.Agashe D., Martinez-Gomez N.C., Drummond D.A., Marx C.J. Good codons, bad transcript: Large reductions in gene expression and fitness arising from synonymous mutations in a key enzyme. Mol. Biol. Evol. 2012;30:549–560. doi: 10.1093/molbev/mss273. [DOI] [PMC free article] [PubMed] [Google Scholar]
- 12.Sharp P.M., Li W.H. The codon Adaptation Index–a measure of directional synonymous codon usage bias, and its potential applications. Nucleic Acids Res. 1987;15:1281–1295. doi: 10.1093/nar/15.3.1281. [DOI] [PMC free article] [PubMed] [Google Scholar]
- 13.Dong H., Nilsson L., Kurland C.G. Co-variation of tRNA abundance and codon usage in Escherichia coli at different growth rates. J. Mol. Biol. 1996;260:649–663. doi: 10.1006/jmbi.1996.0428. [DOI] [PubMed] [Google Scholar]
- 14.Percudani R., Pavesi A., Ottonello S. Transfer RNA gene redundancy and translational selection in Saccharomyces cerevisiae. J. Mol. Biol. 1997;268:322–330. doi: 10.1006/jmbi.1997.0942. [DOI] [PubMed] [Google Scholar]
- 15.Kanaya S., Yamada Y., Kudo Y., Ikemura T. Studies of codon usage and tRNA genes of 18 unicellular organisms and quantification of Bacillus subtilis tRNAs: gene expression level and species-specific diversity of codon usage based on multivariate analysis. Gene. 1999;238:143–155. doi: 10.1016/s0378-1119(99)00225-5. [DOI] [PubMed] [Google Scholar]
- 16.dos Reis M., Savva R., Wernisch L. Solving the riddle of codon usage preferences: a test for translational selection. Nucleic Acids Res. 2004;32:5036–5044. doi: 10.1093/nar/gkh834. [DOI] [PMC free article] [PubMed] [Google Scholar]
- 17.Wright P.E., Dyson H.J. Intrinsically unstructured proteins: Re-assessing the protein structure-function paradigm. J. Mol. Biol. 1999;293:321–331. doi: 10.1006/jmbi.1999.3110. [DOI] [PubMed] [Google Scholar]
- 18.van der Lee R., Buljan M., Lang B., Weatheritt R.J., Daughdrill G.W., Dunker A.K., Fuxreiter M., Gough J., Gsponer J., Jones D.T., et al. Classification of intrinsically disordred regions and proteins. Chem. Rev. 2014;114:6589–6531. doi: 10.1021/cr400525m. [DOI] [PMC free article] [PubMed] [Google Scholar]
- 19.Payjos M., Mészáros B., Simon I., Dosztányi Z. Is there a biological cost of protein disorder? Anaysis of cancer-associated mutations. Mol. BioSyst. 2012;8:296–307. doi: 10.1039/c1mb05246b. [DOI] [PubMed] [Google Scholar]
- 20.Fukuchi S., Homma K., Sakamoto S., Sugawara H., Tateno Y., Gojobori T., Nishikawa K. The GTOP database in 2009: updated content and novel features to expand and deepen insights into protein structures and functions. Nucleic Acids Res. 2009;37:D333–D337. doi: 10.1093/nar/gkn855. [DOI] [PMC free article] [PubMed] [Google Scholar]
- 21.Chan P.P., Lowe T.M. GtRNAdb: A database of transfer RNA genes detected in genomic sequence. Nucleic Acids Res. 2009;37:D93–D97. doi: 10.1093/nar/gkn787. [DOI] [PMC free article] [PubMed] [Google Scholar]
- 22.Nakamura Y., Gojobori T., Ikemura T. Codon usage tabulated from international DNA sequence databases: Status for the year 2000. Nucleic Acids Res. 2000;28:292. doi: 10.1093/nar/28.1.292. [DOI] [PMC free article] [PubMed] [Google Scholar]
- 23.Fukuchi S., Homma K., Minezaki Y., Gojobori T., Nishikawa K. Development of an accurate classification system of proteins into structured and unstructured regions that uncovers novel structural domains: its application to human transcription factors. BMC Struct. Biol. 2009;9:26. doi: 10.1186/1472-6807-9-26. [DOI] [PMC free article] [PubMed] [Google Scholar]
- 24.Hirose S., Shimizu K., Kanai S., Kuroda Y., Noguchi T. POODLE-L: A two-level SVM prediction system for reliably predicting long disordered regions. Bioinformatics. 2007;23:2046–2053. doi: 10.1093/bioinformatics/btm302. [DOI] [PubMed] [Google Scholar]
- 25.Bellay J., Han S., Michaut M., Kim T., Constanzo M., Andrews B.J., Boone C., Bader G.D., Myers C.L., Kim P.M. Bringing order to protein disorder through comparative genomics and genetic interactions. Genome Biol. 2011;12:R14. doi: 10.1186/gb-2011-12-2-r14. [DOI] [PMC free article] [PubMed] [Google Scholar]
- 26.Vavouri T, Semple J.I., Garcia-Verdugo R., Lehner B. Intrinsic protein disorder and interaction promiscuity are widely associated with dosage sensitivity. Cell. 2009;138:198–208. doi: 10.1016/j.cell.2009.04.029. [DOI] [PubMed] [Google Scholar]
- 27.Zhang Y., Wölfle T., Rospert S. Interaction of nascent chains with the ribosomal tunnel proteins Rpl4, Rpl17, and Rpl39 of Saccharomyces cerevisiae. J. Biol. Chem. 2013;288:33697–33707. doi: 10.1074/jbc.M113.508283. [DOI] [PMC free article] [PubMed] [Google Scholar]
- 28.Macossay-Castillo M., Kosol S., Tompa P., Pancsa R. Synonymous constraint show a tendency to encode intrinsically disordered protein segments. PLoS Comp. Biol. 2014;16:589–597. doi: 10.1371/journal.pcbi.1003607. [DOI] [PMC free article] [PubMed] [Google Scholar]
- 29.Warnecke T., Hurst L.D. Evidence for a trade-off between translational efficiency and splicing regulation in determinig synonymous codon usage in Drosophila melanogaster. Mol. Biol. Evol. 2007;24:2755–2762. doi: 10.1093/molbev/msm210. [DOI] [PubMed] [Google Scholar]
- 30.Hegyi H., Kalmar L., Horvath T., Tompa P. Verification of alternative variants based on domain integrity, truncation length and intrinsic protein disorder. Nucleic Acids Res. 2011;39:1208–1219. doi: 10.1093/nar/gkq843. [DOI] [PMC free article] [PubMed] [Google Scholar]
- 31.Smithers B., Oates M.E., Gough J. Splice junctions are constrained by protein disorder. Nucleic Acids Res. 2015;43:4814–4822. doi: 10.1093/nar/gkv407. [DOI] [PMC free article] [PubMed] [Google Scholar]
- 32.Light S., Sagit R., Sachenkova O., Ekman D., Elofsson A. Protein expansion is primarily due to indels in intrinsically disordered regions. Mol. Biol. Evol. 2013;30:2645–2653. doi: 10.1093/molbev/mst157. [DOI] [PubMed] [Google Scholar]
Associated Data
This section collects any data citations, data availability statements, or supplementary materials included in this article.


