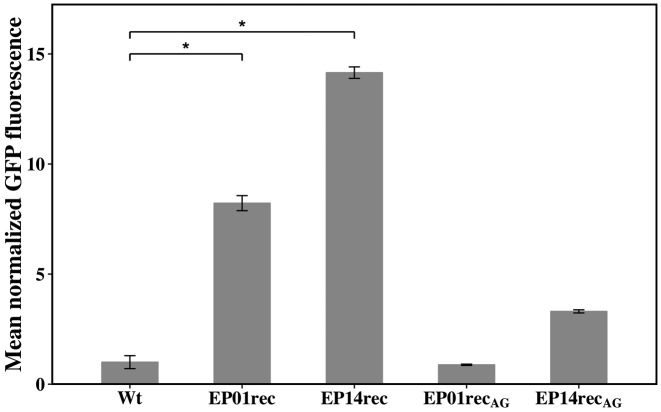
Figure 5.
Representative FACS histograms show the mean normalized GFP fluorescence from LW6 cells transformed with expression vectors containing the wild type E. coli lsrACDBFG operon promoter region (Wt) and the mutants EP01rec, EP14rec, EP01recAG and EP14recAG. GFP expression was measured at two different growth points, OD600nm of 0.5 and 1.0 (only 0.5 shown here). These independent experiments, following β-gal experiments, were performed in technical triplicate and the error bars represent the population's standard deviation. The LW6 strain fluorescence was used as a negative control to set FACS’ voltage and gating, and the Wt sample (E. coli W3110) was used as a normalization factor for data analysis. The statistical significance level was determined to be α = 0.001 (indicated by *) using ANOVA and the Tukey-Kramer method. Fluorescence microscopy images of the FACS samples are also provided (see Supplementary Figure S1).

