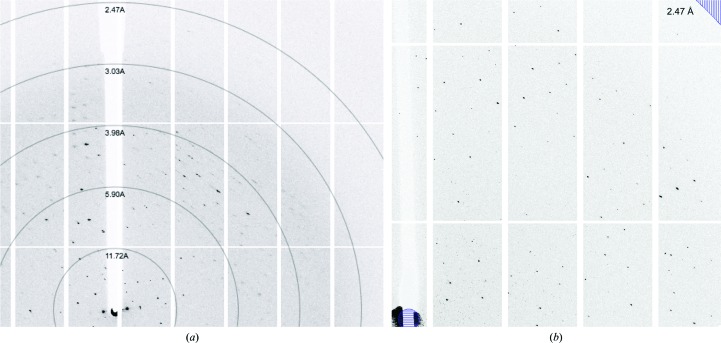
Figure 3.
Diffraction images from a FapF106–430 crystal. (a) Representative diffraction image indicating resolution rings. (b) Enlarged image indicating the final data-processing resolution limit at 2.5 Å. Images were generated in iMosflm (Battye et al., 2011 ▸).

