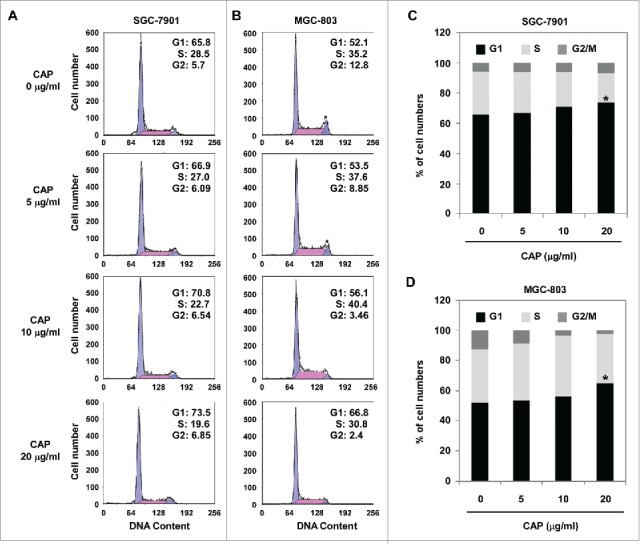
Figure 3.

CAP induced cell cycle arrest in gastric cancer cells. SGC-7901 or MGC-803 cells were treated with 0–20 μg/ml of CAP for 48 h. (A and B) Histogram plot of cell cycle distribution. (C and D) Bar plot of cell cycle distribution. Asterisk: Significant difference (*: p < 0.05) compared to DMSO treatment.
