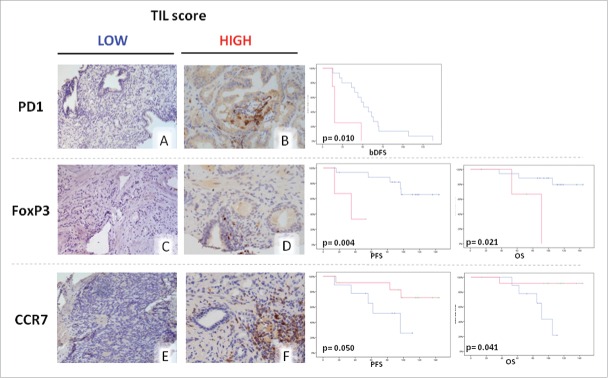
Figure 2.
Kaplan Meier curves related to survival analysis according to lymphocyte infiltration scores. Blue line: low infiltration score group (≤ 10 marker positive cells/ HPF). Red line: high infiltration score (> 10 marker positive cells/HPF). Representative immunohistochemical pictures for each different parameters are reported in A-F. Statistical analyses were performed using SPSS statistical package, version 17.0.

