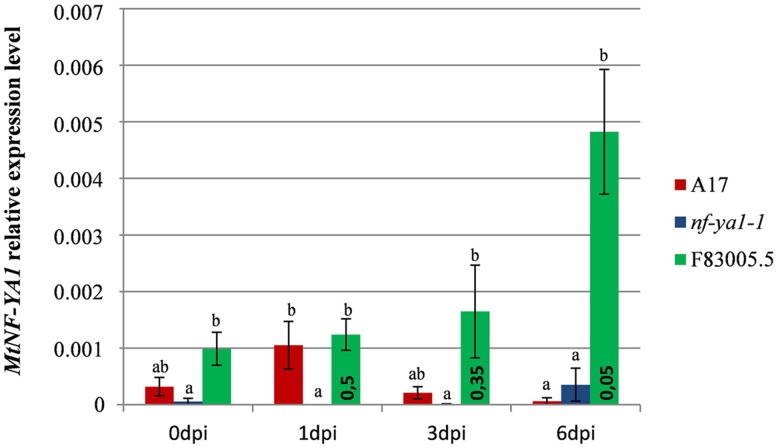
FIGURE 3.
Expression pattern of MtNF-YA1 in A17, nf-ya1-1, and F83005.5 in control and A. euteiches inoculated conditions. Root tissues from five seedlings were pooled in each individual sample and expression level at each datapoint is represented by a mean of three independent samples. The level of MtNF-YA1 expression was analyzed by RT-qPCR and the 2-ΔCT method by using three reference genes as described in “Materials and Methods.” Error bars display standard errors and significance of differential expression level was determined using a Mann–Whitney U test. Groups of expression levels were determined between genotypes at each individual time points, statistically similar expression level belongs to groups a, b or ab and bars which do not share any of these letters are significantly different at p-value threshold 0.05. In addition, a Mann–Whitney U test was performed between 0 dpi and 1, 3, and 6 dpi expression levels in F83005.5 to assess significance of the variations observed across the kinetic, p-values are indicated inside green bars.

