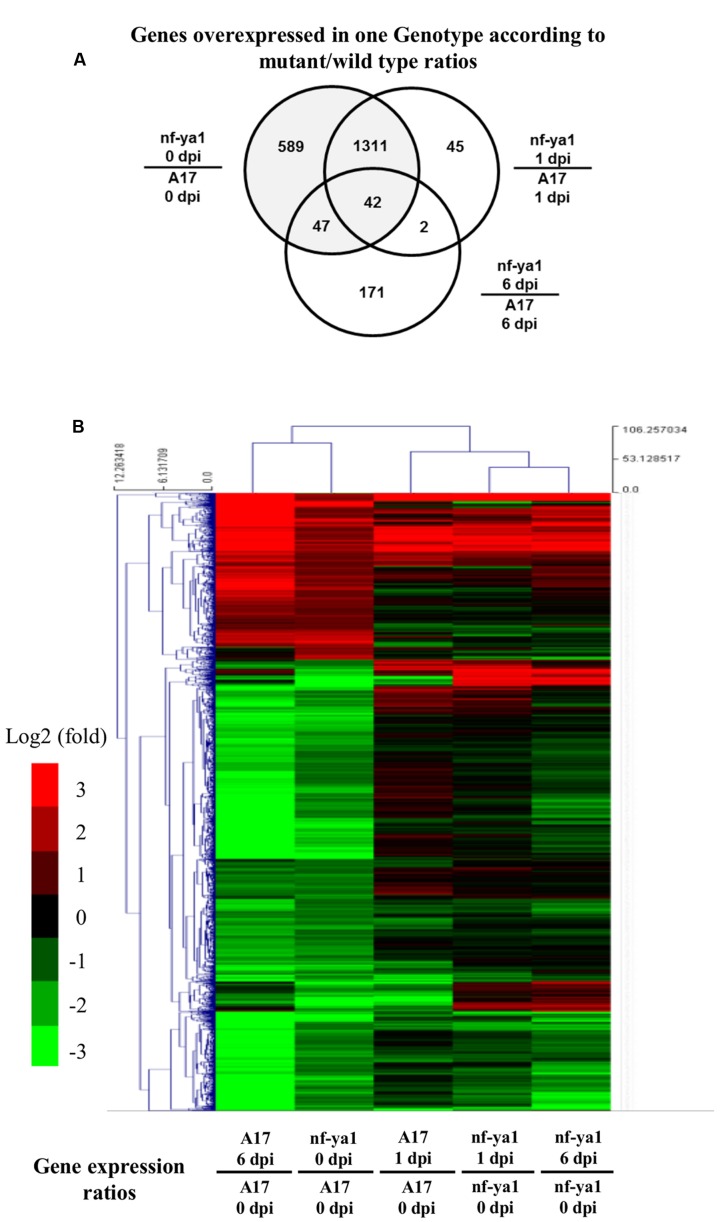
FIGURE 5.
Transcriptomic analysis of A17 and nf-ya-1-1 in healthy plants and upon A. euteiches inoculation. Analyses were performed on probes which were significantly regulated (Tuckey test, Bonferroni-corrected p-value <0.001). (A) Venn Diagram showing probes significantly regulated between genotypes at 0, 1 and 6 dpi. (B) Hierarchical clustering of genotype-dependent probes regulated upon A. euteiches inoculation. Induced probes (log2 ratio > 1) are in red, repressed probes (log2 ratio <-1) are in green. The detail of the gene annotation and their position in the cluster can be found in Supplementary Table 4.

