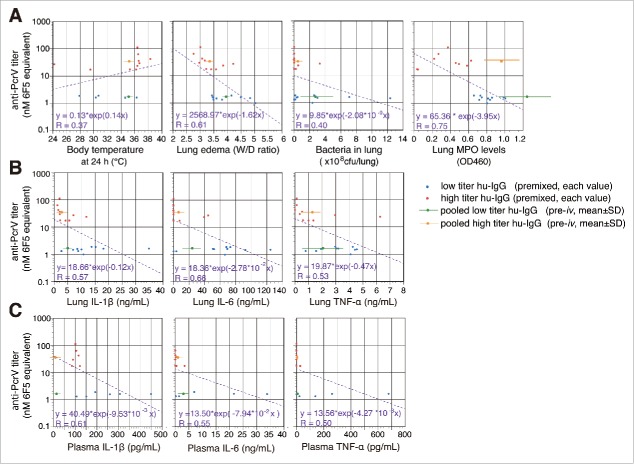
Figure 9.
Correlation and linear regression analyses (in hemi-logarithmic plots) between anti-PcrV titers and various biological values of premixed series. A. The xy correlations between body temperature, lung edema, bacteria in lungs and lung myeloperoxidase levels (x values), and anti-PcrV titers (nM 6F5 equivalent, y values) at 24 h post-infection. B. The xy correlations between various lung cytokine levels (x values) and anti-PcrV titers (y values). C. The xy correlations between plasma cytokine levels (x values) and anti-PcrV titers (y values). Red circles are the values from premixed high titer hu-IgG, and the blue circles are values from premixed low titer hu-IgG. An orange circle with a bar denotes the mean ± SD values from the pooled high titer hu-IgG pre-iv series, and a green circle with a bar denotes the mean ± SD values from the pooled low titer hu-IgG pre-iv series.

