
Figure 2.
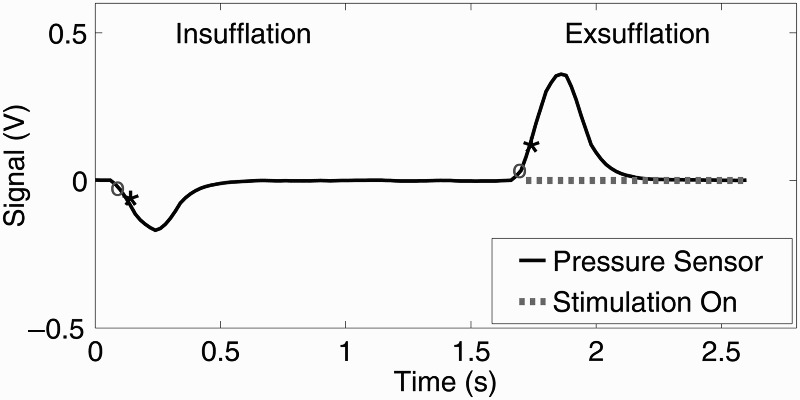
Pressure sensor signal recorded at assessment session six (A6), providing a graphical representation of the stimulation triggering algorithm. Stimulation was automatically applied at the start of exsufflation, identified as a sample greater than 0.05 V (shown by black ∗) proceeding a sample of less than 0.05 V (shown by grey o), when the previous zero crossing was an insufflation (detected using the opposite logic as shown at 0.1 s). The point where stimulation is applied during exsufflation is represented by a dotted grey line.