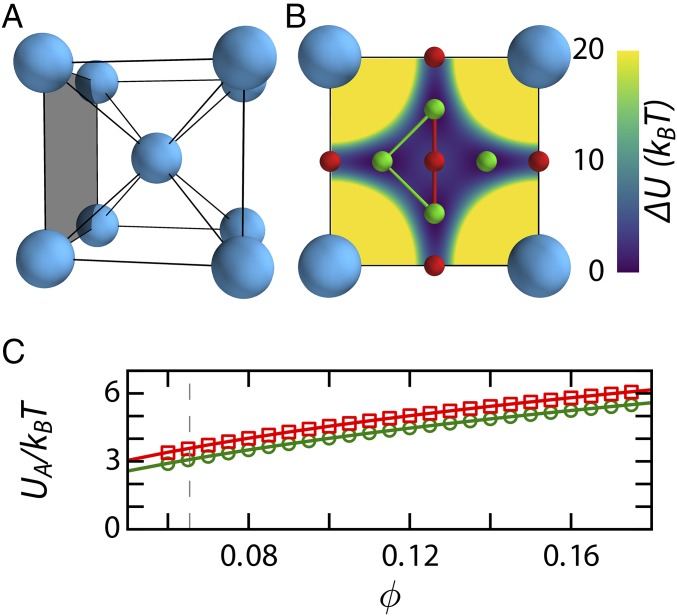
Fig. 1.
(A) Schematic representation of a BCC unit cell. (B) The interstitial sites in a plane of the BCC unit cell with tetrahedral sites in green and octahedral sites in red. The T–T path (green) and T–O–T path (red) are indicated with lines connecting the interstitial sites. The potential field felt by the dopant is shown in the background. The values are the potential energy with respect to the global minimum at the tetrahedral site. Yellow indicates values of and above. (C) Hopping barrier along a T–T (circles) and a T–O–T (squares) path from numerical calculations. The solid lines are a parametric fit to as described in the text, and the dashed line indicates the melting point .

