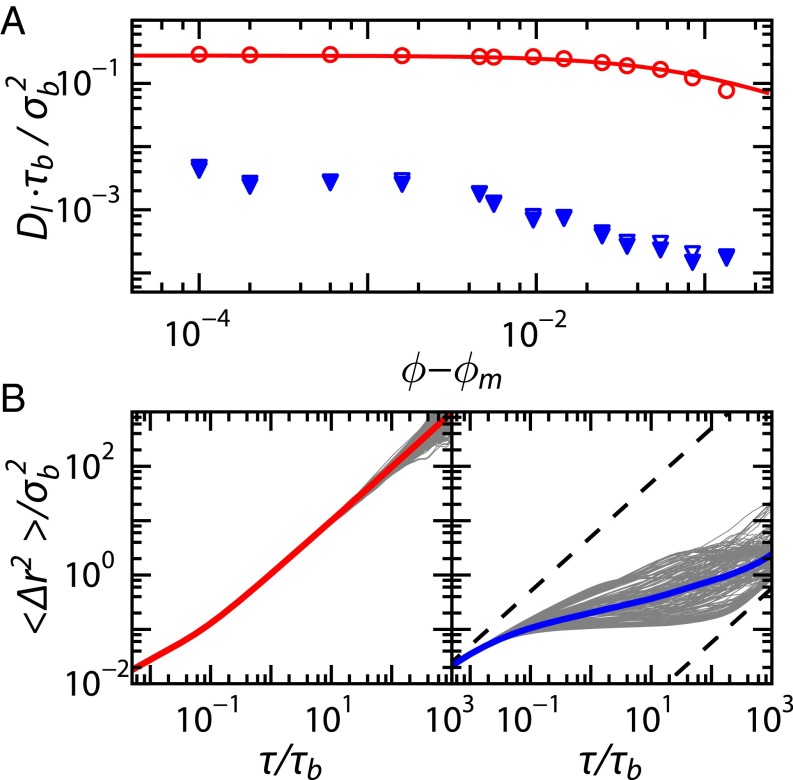
Fig. 4.
(A) Long-time diffusion coefficients as a function of distance to the melting point for static (circles) and dynamic (triangles) crystals, with as determined in Fig. S1. Open symbols indicate determined from the mean-squared displacements at , whereas solid symbols are computed by extrapolating to infinity. The solid line is a fit to the transition-state prediction for , as described in the text. (B) for individual particles, with the ensemble-average (thick line) superposed for a fixed (Left) and a dynamic (Right) crystal.

