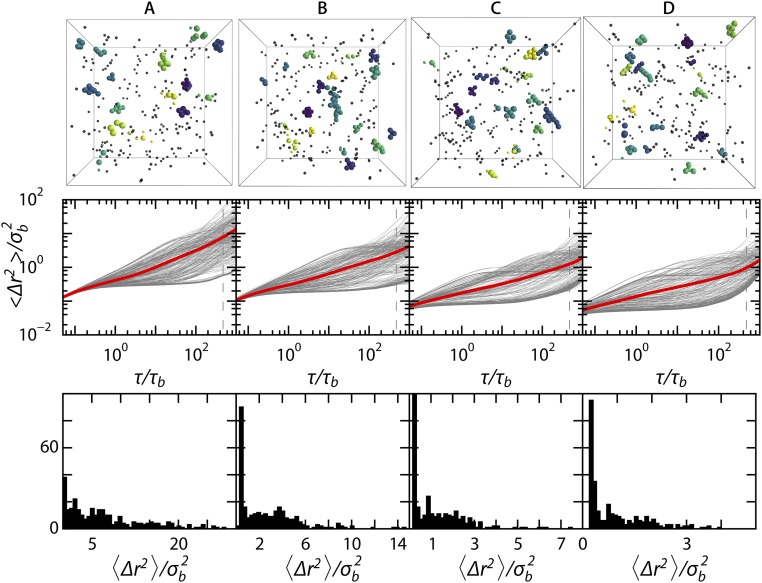
Fig. S6.
Cluster analysis at different volume fractions: (A) , (B) , (C) , and (D) . Systems all have 1:47. (A–D, Top) Snapshots of cluster formation at . Only the clusters with are highlighted for clarity. (A–D, Middle) curves per particle (gray) and the ensemble average (red). (A–D, Bottom) Histograms of the at over 50 bins.

