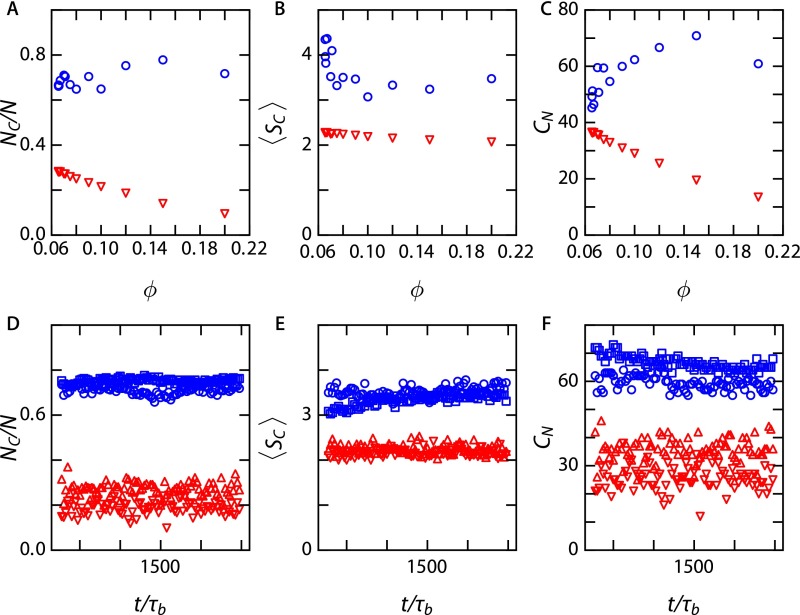
Fig. S9.
(A) The average fraction of clustered particles against . (B) Averaged cluster size as a function of . (C) Average amount of clusters vs. . Values are for 1:47 in a static base crystal (red triangles) and in a dynamic base crystal (blue circles). (D–F) Behavior of , , and during the simulation at two different volume fractions (blue circles and red downward-pointing triangles) and (blue squares and red upward-pointing triangles).

