Fig. 6.
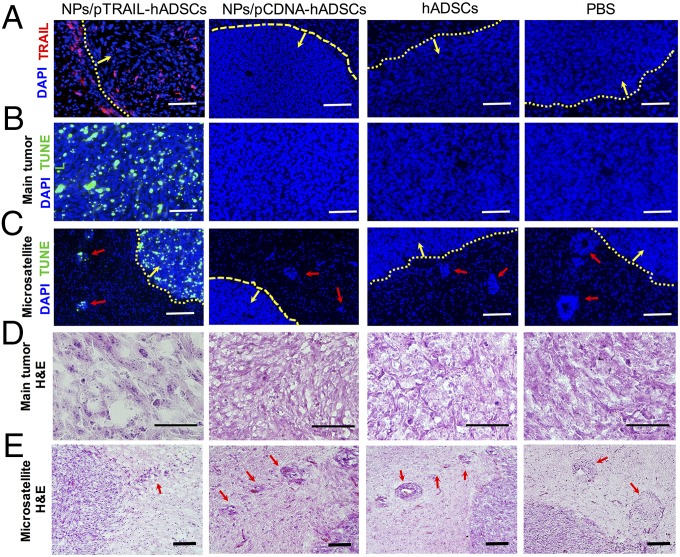
TRAIL-overexpressing hADSCs induced GBM apoptosis and reduced tumor mass and the occurrence of microsatellites in a mouse GBM xenograft model. Mice were treated with NPs/pTRAIL-hADSCs or controls (NPs/pCDNA-hADSCs, unmodified hADSCs, or PBS solution control) at day 5 after glioma (7 × 10⁵ cells) inoculation. Brain tissues were harvested 10 d after treatment for histologic examination. (A) Positive staining for TRAIL (red) was evidenced in the tumor mass and around the tumor border, indicating the survival of TRAIL-overexpressing hADSCs. No TRAIL expression was detected in controls. (B and C) TUNEL staining confirmed TRAIL-hADSCs induced specific apoptosis in GBM tumor mass (B) and in microsatellites (C), but not in controls. Red indicates TRAIL, blue indicates cell nuclei, green indicates TUNEL, red arrow indicates microsatellite outgrowing from primary tumor mass into adjacent normal brain, yellow arrow points to inside tumor mass, and dotted yellow line indicates tumor edge. (D) Hematoxylin and eosin (H&E) staining of tumor mass showed disrupted tumor morphology and markedly reduced tumor density in the NPs/pTRAIL-hADSC–treated group versus control groups. (E) H&E staining of tumor/normal brain interface. Fewer microsatellites occurred in NPs/pTRAIL-hADSC–treated group than that in the control groups. Red arrow indicates microsatellite outgrowth from the primary tumor mass into adjacent normal brain. (Scale bars, 100 μm.)

