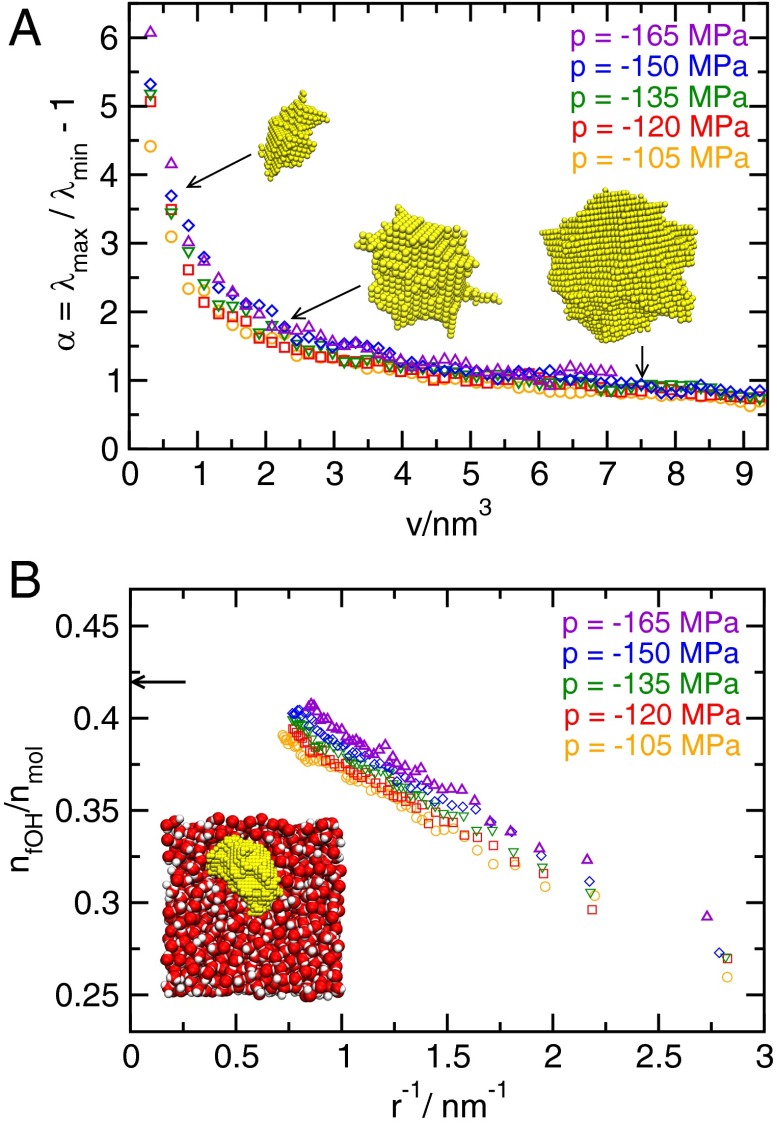
Fig. 2.
Shape and hydrogen bonding structure of bubbles. (A) Asphericity α as a function of bubble volume from configurations obtained via umbrella sampling. By construction, α is zero for a perfect sphere, and higher values indicate shapes with higher aspect ratios. Also shown are bubbles (not to scale) observed at whose asphericities and volumes are indicated by arrows. (B) Fraction of free OH groups at the bubble surface as a function of the inverse radius of a sphere with volume v. The arrow indicates the fraction for a flat interface at at ambient pressure from ref. 64. Note that we give the fraction of broken hydrogen bonds per molecule, so the highest possible value is 2. The depicted configuration contains a bubble of critical size at a pressure of , where the yellow spheres indicate the unoccupied grid points forming the largest bubble.

