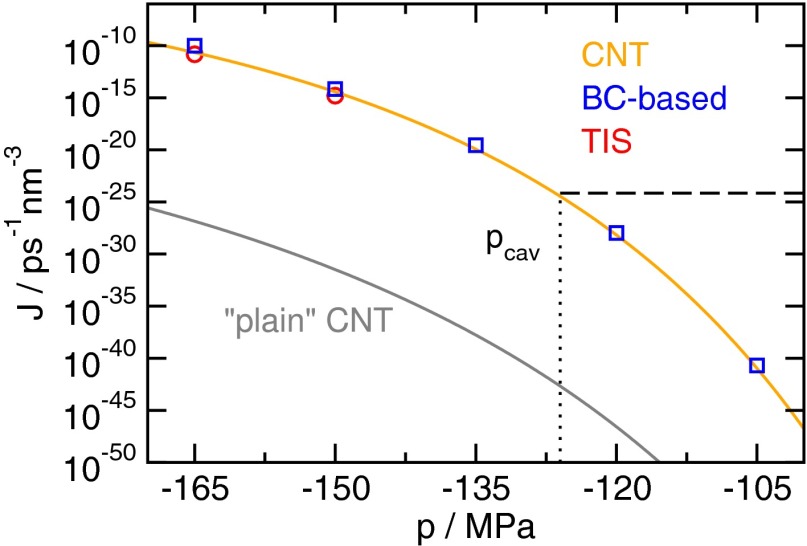
Fig. 4.
Predictions obtained from CNT using microscopic information are in excellent agreement with cavitation rates J from direct simulation. The estimates obtained from simulations by a variant of the Bennett–Chandler method (blue squares) agree well with the transition interface sampling (red circles) reference calculations (Materials and Methods). Predictions of curvature-corrected CNT (orange line) with the correct value of using the kinetic prefactor shown in Fig. 3 yield excellent agreement with simulation results, whereas plain CNT (gray line) severely underestimates the cavitation rate. For plain CNT, we chose , where and are the number density of the liquid and the vapor, respectively (68). These rate estimates allow for a direct comparison with conflicting experimental predictions on the stability of water under tension by computing the cavitation pressure . Following ref. 22, we define such that the probability to observe a cavitation event is in a system of volume over an observation time of . Assuming that the cavitation events are associated with an exponential waiting time, as is typical for activated processes, a rate of (dashed black line) is compatible with this requirement. Its intersection with the CNT prediction gives the cavitation pressure .

