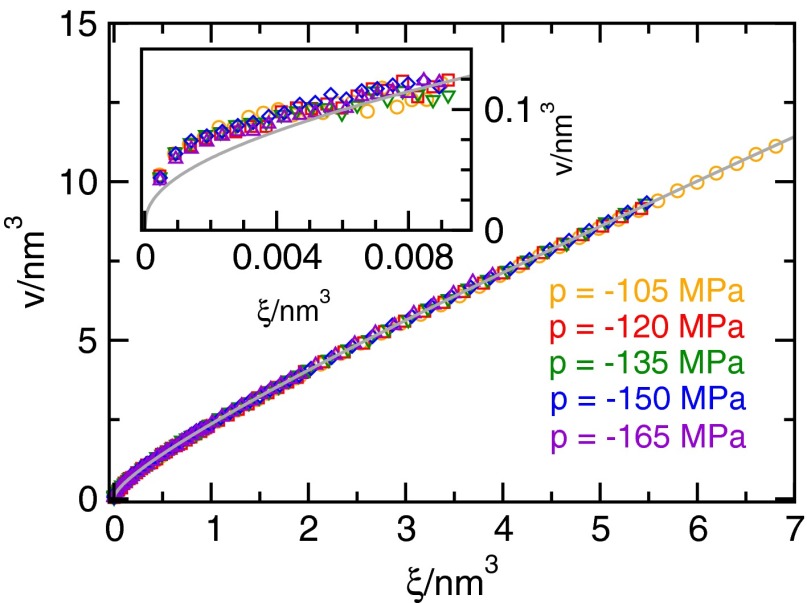
Fig. S5.
Average change v in system volume V due to the presence of a cluster of vapor-like cubes, i.e., a bubble, with volume ξ. The gray line indicates the fit given by Eq. S1. The inset magnifies the small-bubble regime, where each data point for v was obtained according to Eq. 6. Data points only shown in the main plot and not included in the inset were obtained according to Eq. 7.

