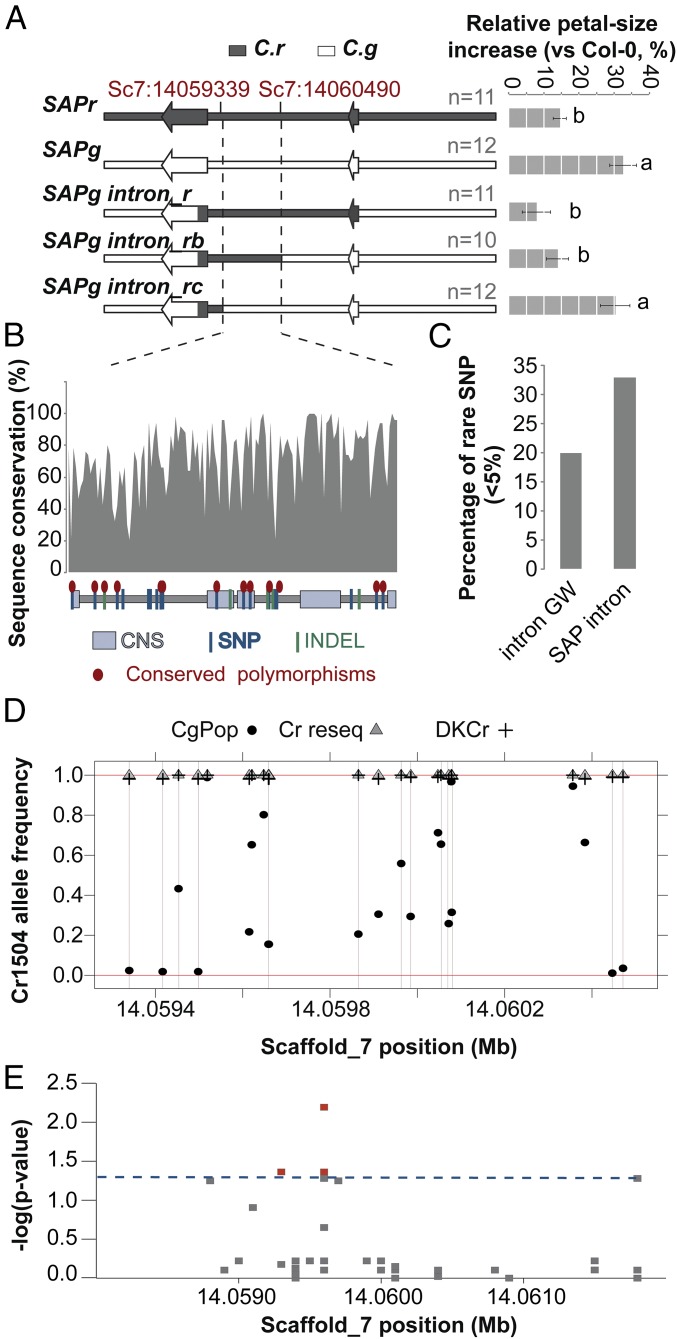
Fig. 4.
The SAP small-petal allele has been captured from C. grandiflora standing variation. (A) Effect of SAPg/SAPr chimeric genomic constructs on the size of Col-0 petals indicates that the causal polymorphisms are contained in a 1.1-kb region within SAP intron. The schemes of the constructs used are shown (Left); bar chart (Right) displays the percentage increase in petal size. Values are mean of the average petals size of each transgenic line normalized to the Col-0 petal-area average for each genotype. Error bars represent SEM. The number of independently transformed line used to obtain the mean values is indicated on the figure. Letters indicate significant differences as determined by Tukey’s honest significant difference test. (B) Sequence conservation within the SAP intron determined as the percentage identity between different Brassicaceae species within 10-bp windows. The scheme in the bottom represents the identified polymorphisms between Cr1504 and Cg926 as well as the conserved noncoding sequences (CNS) identified by ref. 22. Conserved polymorphisms shared between the two C. rubella versus the two C. grandiflora alleles used for transformation are indicated by red ellipses. (C) The SAP intron shows a higher percentage of rare SNPs within C. grandiflora compared with introns genome-wide (intron GW), suggesting purifying selection. (D) The analysis of Cr1504 allele frequency in C. grandiflora and C. rubella populations failed to identify fixed polymorphisms between the two species. All sites comprised in the 1.1-kb causal region underlying PAQTL_6, and polymorphic between Cr1504 and Cg926 were analyzed. Note that although the C. rubella alleles were at very low frequency in C. grandiflora at some positions, none of these frequencies were equal to 0. (E) Local association mapping identifies several polymorphisms within the SAP intron associated with petal-size variation in the C. grandiflora population. The y axis shows false-discovery rate adjusted negative log P values. Dashed blue line indicates 5% significance threshold.

