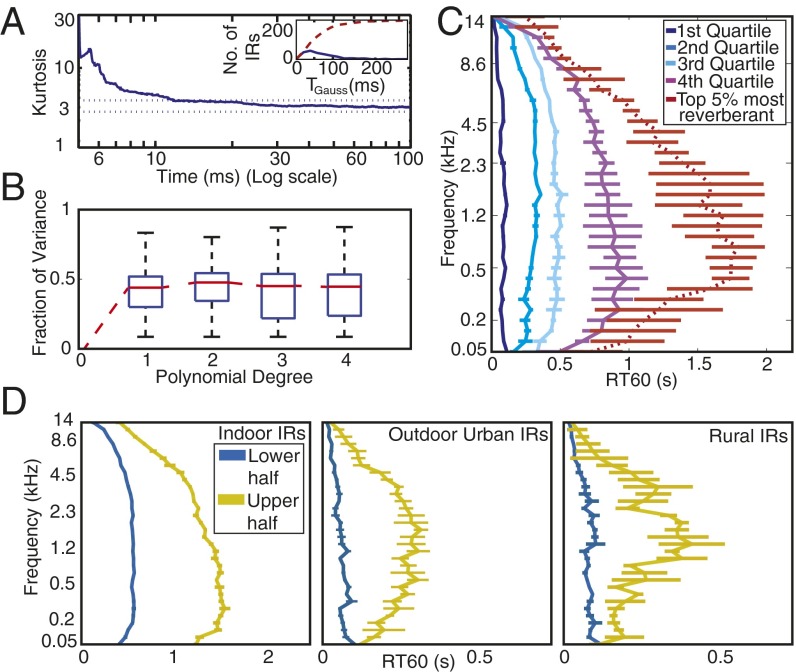
Fig. 4.
Statistics of natural reverberation. (A) IRs have locally Gaussian statistics. Graph plots median kurtosis (sparsity) vs. time for the surveyed IRs. The kurtosis for each IR was calculated in 10-ms windows; the line plots the median across all surveyed IRs for each time point. Here and elsewhere in this figure, error bars show 95% confidence intervals obtained by bootstrap. Horizontal dotted lines show 95% confidence intervals of the kurtosis of 10-ms Gaussian noise excerpts. (A, Inset) Histogram (solid line) of the time at which the IR kurtosis reached the value for Gaussian noise () across the surveyed IRs, along with the corresponding cumulative distribution function (dashed line). (B) Energy decays exponentially. Graph displays box plots of the distribution of the fraction of variance of IR subband envelopes accounted for by polynomial decay models of degree P for P = [1,2,3,4]. The model was fitted to the data recorded by the left channel of the recorder and evaluated on the data recorded by the right channel (i.e., the variance explained was computed from the right channel). The two channels were connected to different microphones that were oriented 90° apart. They thus had a different orientation within the environment being recorded, and the fine structure of the recorded IRs thus differed across channels. Using one channel to fit the model and the other to test the fit helped to avoid overfitting biases in the variance explained by each polynomial. (C) Frequency dependence of reverberation time (RT60) in the surveyed IRs. Lines plot the median RT60 of quartiles of the surveyed IRs, determined by average RT60(T, Eq. S9). Dotted red line plots the median value for the most reverberant IRs (top 5%). (D) Median RT60 profiles (as in C except using halves rather than quartiles because of smaller sample sizes) for indoor environments (n = 269), outdoor urban environments (e.g., street corners, parking lots, etc., n = 62), and outdoor rural environments (forests, fields, etc., n = 29). To increase sample sizes we supplemented the 271 IRs measured here with those of two other studies (ref. 22 and www.echothief.com).

