Fig. S2.
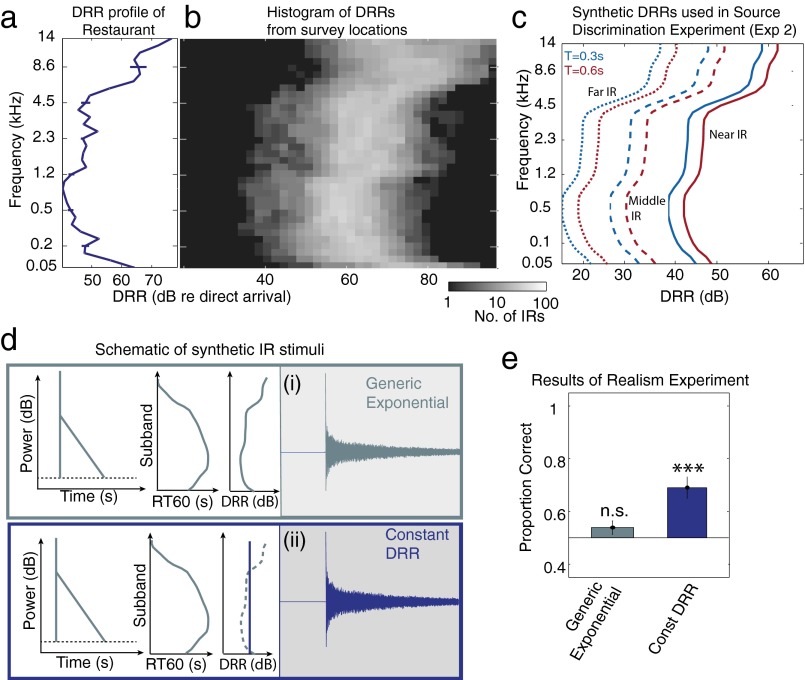
Direct-to-Reverberant Ratio (DRR)—measurements and experiments. (A) The DRR profile of the example IR from Figs. 1 and 3. See Fig. 3F for a schematic of DRR measurement. Error bars show 95% confidence intervals obtained by bootstrapping from the acoustic measurement (by fitting the exponential decay model to multiple random subsets of samples from the time series). (B) Histogram of subband DRRs of all surveyed IR locations. (C) DRR profiles used to create synthetic IRs in the source discrimination experiment (experiment 2). We observed a weak dependence of median DRR on broadband RT60; to mimic this effect in our synthetic IRs the long experimental IRs (T = 0.6 s) had slightly lower DRRs than the short experimental IRs (T = 0.3 s). (D) Conditions from experiment 1 (real vs. synthetic reverberation discrimination) in which DRR was manipulated. Listeners discriminated generic exponential IRs and IRs with constant DRR (in which the DRR was set to the mean value of the generic exponential IR DRR across subbands) from real-world IRs. (E) The proportion of trials in which human subjects correctly identified the synthetic IR for each IR type. The generic exponential data are replotted from Fig. 6. ***P < 0.001 (two-tailed t test) as in Fig. 6.

