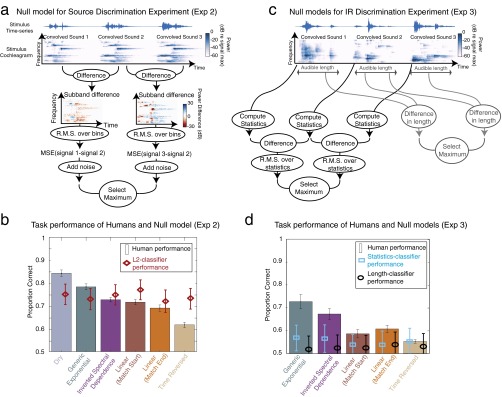
Fig. S5.
Null models of separation task performance. (A) Schematic of the null model for source discrimination using cochleagram differences. (B) Human performance on the source discrimination experiment compared with the null model. Results from IRs of differing length (Fig. 7B) have been averaged. Error bars show 95% confidence intervals obtained by bootstrap. Random noise was added to the decision stage of the null model to equate average performance across all IR classes with that of humans. (C) Schematic of two null models for IR discrimination using either cochleagram statistics or audible signal length. (D) Human performance on the IR discrimination experiment compared with the null models. Results from IRs of differing length (Fig. 7D) have been averaged. Error bars of both human and null model performance show 95% confidence intervals obtained by bootstrap.

