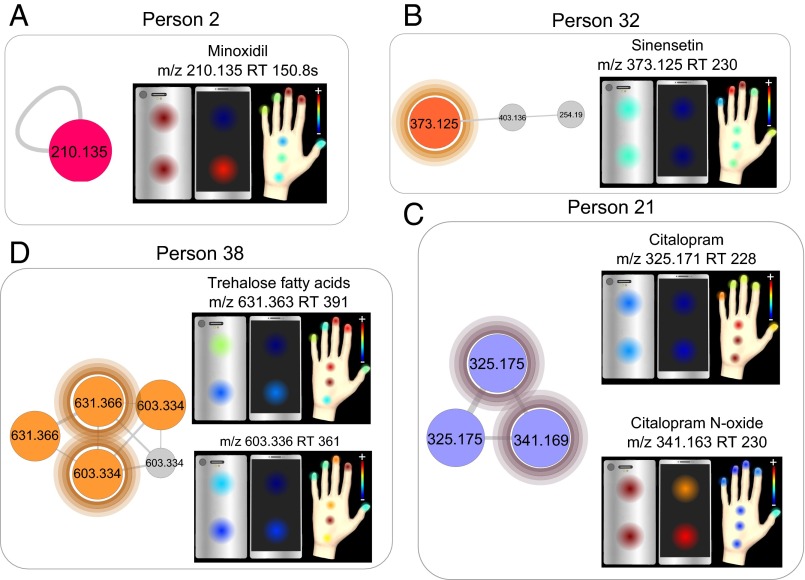
Fig. 6.
Spatial mapping of lifestyle chemicals detected on hands and phones of individuals. Two-dimensional spatial maps generated from LC-MS1 data display the localization and abundance of molecules of interest on hands and phones of four individuals. Figure highlights phone and hand localization of (A) the hair loss treatment molecule minoxidil (m/z 210.135; RT, 150.8 s) on person 2, (B) sinensetin (m/z 373.125; RT, 230 s) on person 32, (C) antidepressant citalopram (m/z 325.171; RT, 228) and its metabolite citalopram N-oxide (m/z 341.163; RT 230) on person 21, and (D) trehalose fatty acids (m/z 631.363; RT 391) and its analog (m/z 603.336; RT 361) on person 38. Color scale is associated to the relative abundance of features, with red corresponding to the highest relative abundance; this is indicated as a plus (+), and the minus (−) is the lowest abundance.

