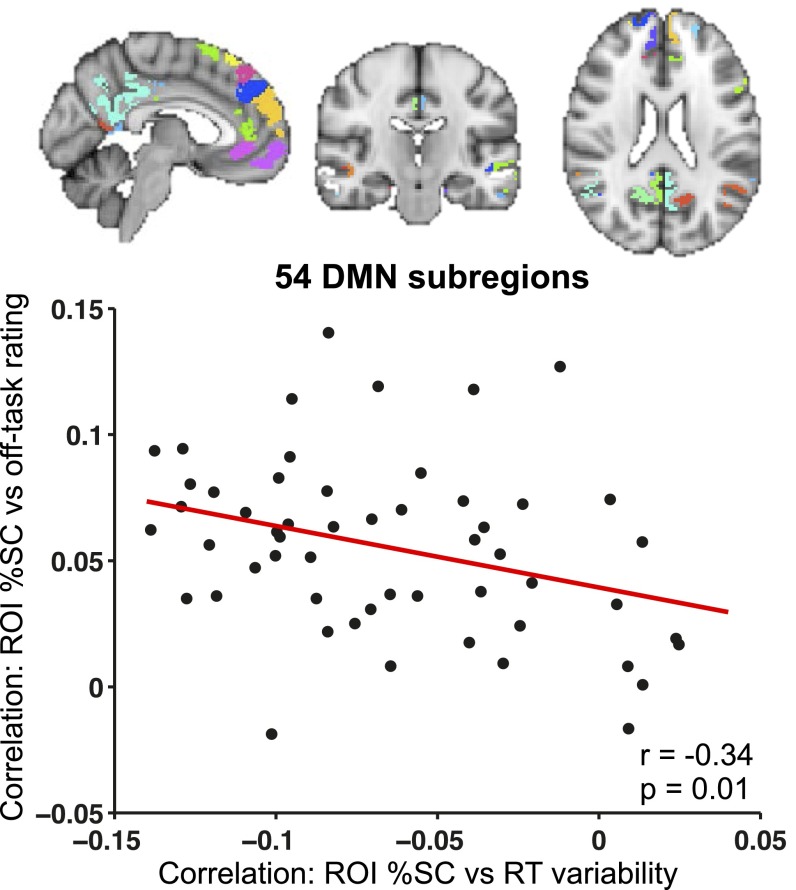
Fig. S4.
Correspondence of DMN areas associated with off-task attention and those associated with behavioral variability. (Top) Subregions of the DMN shown in different colors (54 total subregions). (Bottom) Plot of the correlation of %SC in a subregion with RT variance vs. the correlation of %SC with within-subject normalized off-task rating (r = –0.34, P = 0.01). Correlation values for each subregion were based on all trial blocks concatenated across all subjects. DMN, default mode network; ROI, region of interest; SC, signal change.

