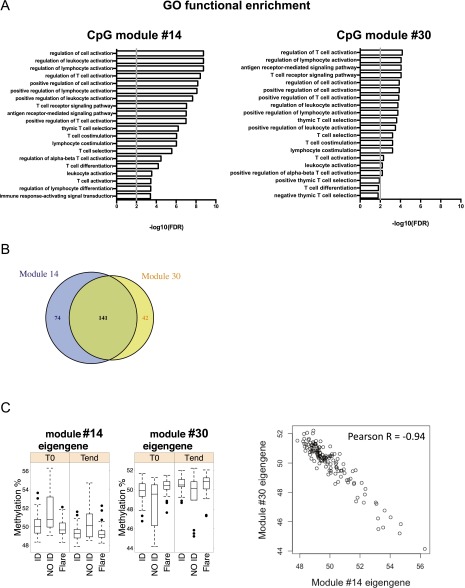
Fig. S2.
CpG module #14 strongly overlaps with CpG module #30. (A) Functional enrichment analyses of CpG modules #14 (Left) and #30 (Right), both associated with the NO ID state but not with age or gender. The top 20 GO terms (FDR-adjusted P < 0.01) and the gene overlap between modules and GO categories are shown, ranked by P value. The gray vertical line indicates a threshold of FDR-adjusted P = 0.01. (B) Number of CpG sites uniquely belonging to or shared by modules #14 and #30. (C) Inverse correlation between the eigenegenes of CpG modules #14 and #30. In the box plots (Left), samples are aggregated by clinical activity. In the dot plot (Right), each point is a sample, regardless of clinical activity. In both plot types, the eigengene methylation level is shown.

