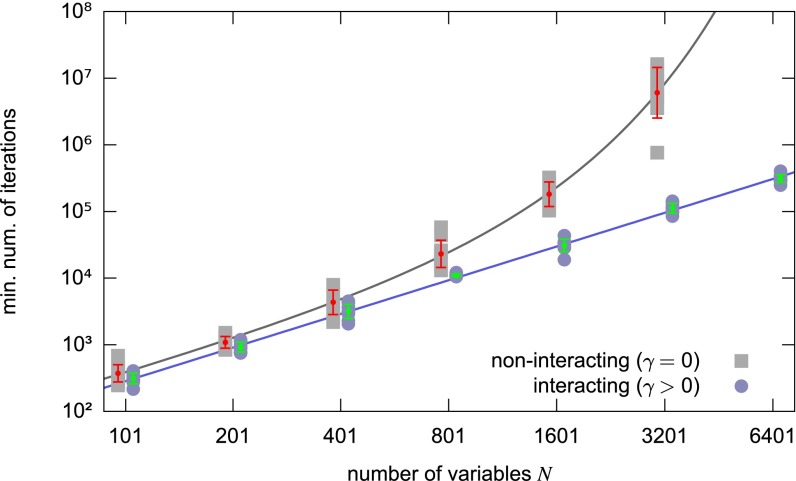
Fig. 2.
Replicated SA on the perceptron, comparison between the interacting version (i.e., which seeks regions of high solution density) and the noninteracting version (i.e., standard SA), at patterns per synapse using replicas. With optimized annealing/scoping parameters, the minimum number of iterations required to find a solution scales exponentially with for the standard case and polynomially for the interacting case. Ten samples were tested for each value of (the same samples in both cases). The bars represent averages and standard deviations (taken in logarithmic scale) and the lines represent fits. The interacting case was fitted by a function with , , and the noninteracting case was fitted by a function with , , , . Data are not available for the noninteracting case at because we could not solve any of the problems in a reasonable time (the extrapolated value according to the fit is ). The two datasets are slightly shifted relative to each other for presentation purposes. All of the details are reported in SI Appendix.

