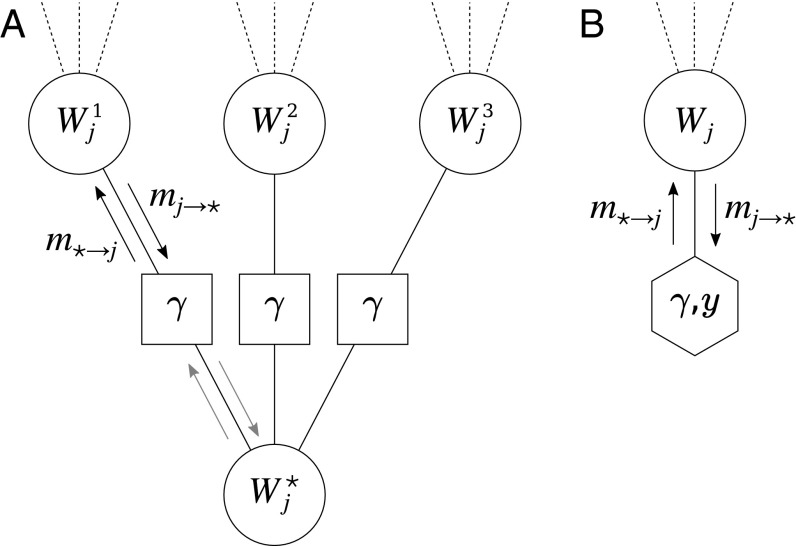
Fig. 4.
(A) Portion of a BP factor graph for a replicated variable with replicas and a reference configuration . The dashed lines represent edges with the rest of the factor graph. The squares represent the interactions . All BP messages (arrows) are assumed to be the same in corresponding edges. (B) Transformed graph that represents the same graph as in A but exploits the symmetry to reduce the number of nodes, keeping only one representative per replica. The hexagon represents a pseudoself-interaction, that is, it expresses the fact that depends on and is parametrized by and .

