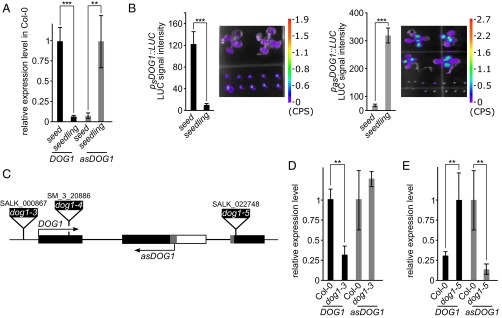
Fig. 2.
Tissue-specific expression pattern of asDOG1. DOG1 and asDOG1 show opposite patterns of expression in freshly harvested seeds and seedlings, when (A) assayed in Col-0 (WT) using RT-qPCR or (B) by measuring luciferase activity in transgenic plants expressing DOG1 (Left) or asDOG1 (Right), fused with LUC. Luciferase activity was quantified and normalized to the signal area. Images of seedlings (Upper) and seeds (Lower) expressing luciferase were taken with a NightSHADE (Berthold) camera. Colored bar next to image represents light intensity scale in counts per second (CPS). Error bars for B represent 95% confidence interval (CI). (C) Schematic diagram of DOG1 gene structure; black boxes, exon sequences; gray boxes, alternative exonic regions; white box region included in alternatively polyadenylated DOG1 short transcript; arrows show the sense and antisense transcripts. The positions of T-DNA insertions are indicated by black rectangles: dog1-3 (SALK_000867), dog1-4 (SM_3_20886) and dog1-5 (SALK_022748). (D) Down-regulation of the DOG1 sense transcript in dog1-3 does not affect the expression of asDOG1. Relative expression levels in freshly harvested seeds measured by RT-qPCR. (E) The dog1-5 mutant shows up-regulation of short DOG1 and down-regulation of asDOG1 expression. Relative expression levels in freshly harvested seeds measured by RT-qPCR. **P < 0.01 and ***P < 0.001. RT-qPCR results were normalized against the UBC mRNA level and are the means of three biological replicates with error bars representing SD.

