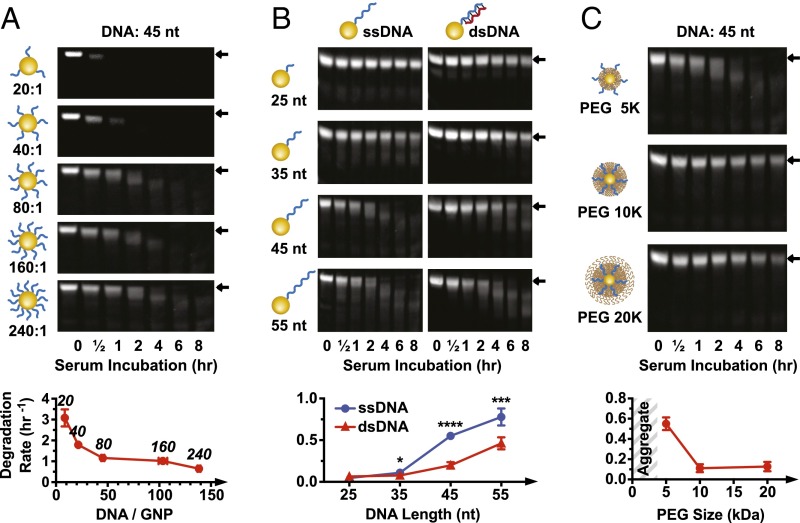
Fig. 2.
Effect of DNA density, length, and PEG-layer thickness on serum degradation. (A) Degradation of nanoparticles with different DNA grafting ratios. Degradation rates (densitometry curves are in SI Appendix, Fig. S2D) plotted against DNA loading (quantified in SI Appendix, Fig. S2A). The number above each data point indicates the grafting ratio. All nanoparticles are backfilled with 5 kDa PEG. (B) Serum degradation of nanoparticles with ssDNA or dsDNA of variable length. Degradation rates based on densitometry curves are in SI Appendix, Fig. S4A. All nanoparticles are backfilled with 5 kDa PEG. Statistical significance between ssDNA and dsDNA for each oligonucleotide length was determined by unpaired t test. *P ≤ 0.05; ***P ≤ 0.001; ****P ≤ 0.0001. (C) Serum degradation of nanoparticles with ssDNA and 5, 10, or 20 kDa PEG backfill (grafted at 16,000 PEG GNP). Densitometry curves are in SI Appendix, Fig. S4B. Error bars are 95% confidence intervals of curve fitting based on three experimental replicates; representative PAGE gel data are shown.

