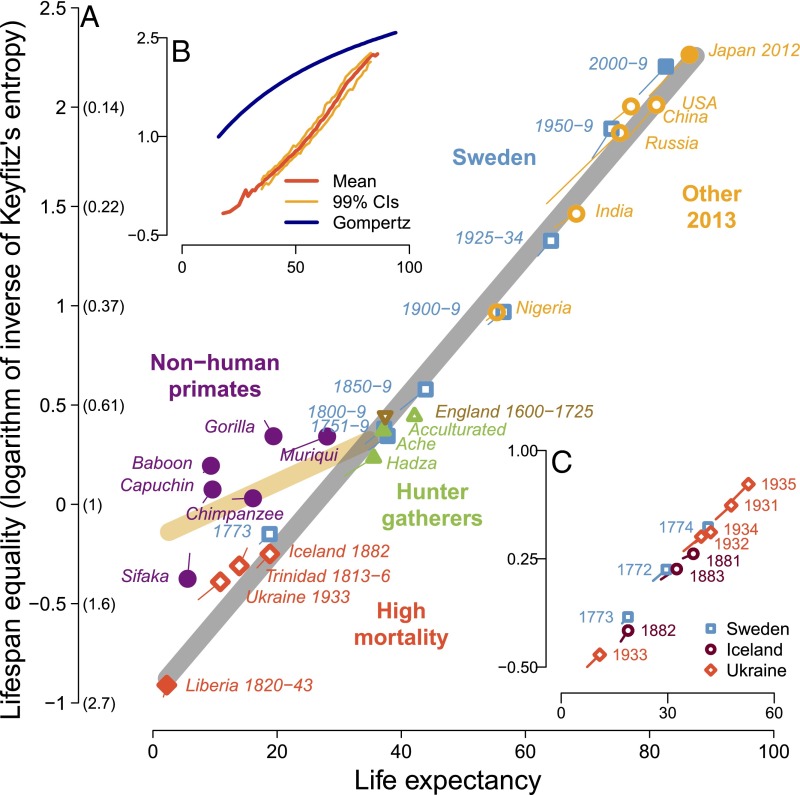
Fig. 4.
The continuum of lifespan equality and life expectancy in primates. In A–C, the y axis shows our measure of lifespan equality, the log of the inverse of Keyfitz’s entropy; corresponding values of Keyftiz’s entropy are given in parentheses in A. (A) The evolutionary-historical continuum in lifespan equality and life expectancy for the 12 focal populations (Fig. 1) and 16 additional human populations (Table S4). The equation for the gray regression line is (slope: t = 41.45, P < 0.0001, df = 20), and for the yellow regression line (slope: t = 3.34, P = 0.02, df = 7), where denotes the estimated lifespan equality for the ith population and life expectancy. We also estimated a version of the yellow regression line using only hunter-gatherer data for humans: This line is (slope: t = 3.17, P = 0.02, df = 7). (B) The continuum for 8,198 human life tables. The blue curved line describes the relationship between lifespan equality and life expectancy if mortality follows Gompertz’s law, i.e., if the risk of death rises exponentially, increasing 14%/y. Because of the paucity of observations, the 99% confidence intervals (CIs) are not shown for life expectancies below 35 y or over 85 y. (C) The continuum for three short-term crisis populations when mortality sharply rose and then sharply declined from year to year. In A and C, data for female–male pairs from each population are indicated by a point with a “tail”; the point represents female values, with male values at the end of the tail.

