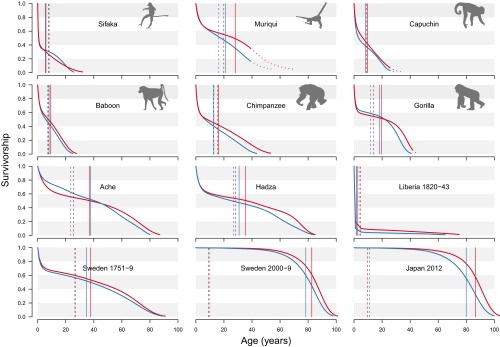
Fig. S1.
Survivorship curves for each sex for the 12 datasets analyzed. Each panel represents the survivorship (proportion surviving) for females (red) and males (blue) for the seven species including six datasets for humans. The solid vertical lines mark life expectancies for each sex. The dashed vertical lines indicate the average number of years of life expectancy lost due to death. Keyfitz’s entropy is given by this value divided by life expectancy (Box 1). For the muriqui, capuchin, and female gorillas, the curves are extrapolated beyond maximum estimated lifespans within the dataset, as indicated by dotted curves and diagonal shading (Materials and Methods).

