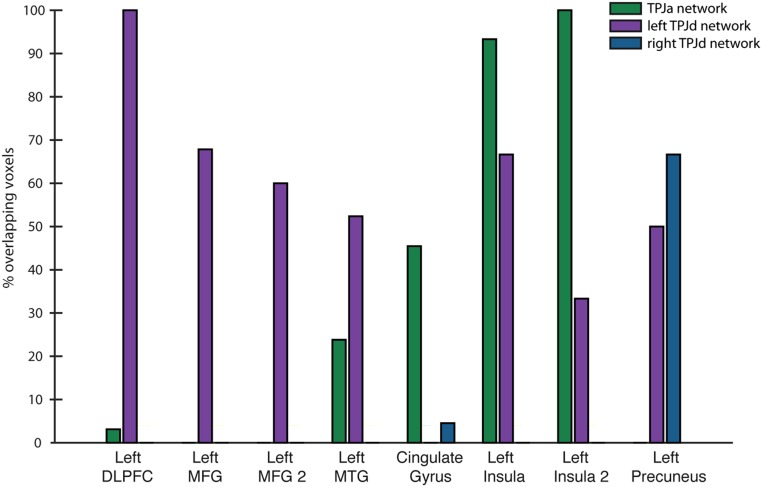
Fig. S2.
Overlap of functional connectivity results with task-related activity outside of the TPJ. y axis shows the percentage of voxels in each cluster outside the TPJ reported in Table 1 overlapping with the networks seeded by each of three TPJ ICs (TPJa, left TPJd, right TPJd). “Left MFG 2” refers to the second left MFG cluster in Table 1. “Left Insula 2” refers to the second left insula cluster in Table 1.

