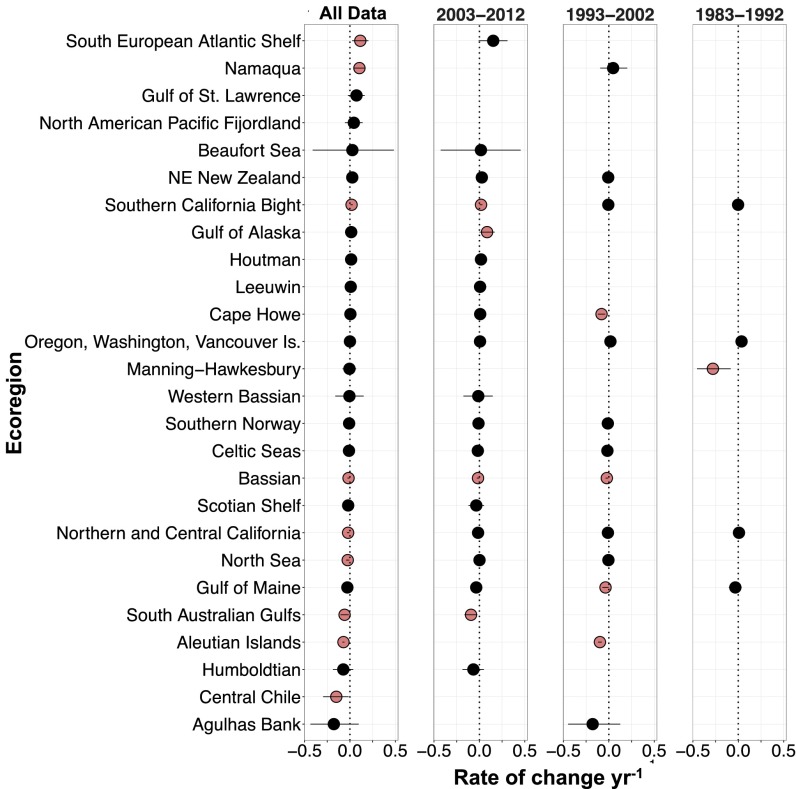
Fig. 2.
Modeled ecoregion slopes (instantaneous rate of change per year) and 90% credible intervals for the full dataset (n = 8,846 data points from 26 ecoregions), with variable temporal coverage in each ecoregion, and by decade (1983–1992, 1993–2002, and 2003–2012). Ecoregion means are colored red if the 90% credible intervals (i.e., high probability) do not overlap zero.

