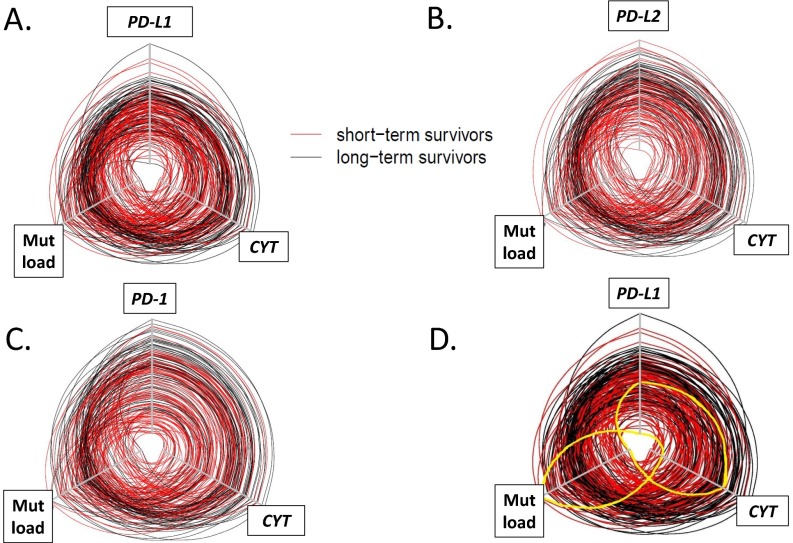
Fig. S5.
Hive plots demonstrating interrelationship between PD-L1, PD-L2, or PD-1, CYT, and mutational load and survival in SKCM. Each line represents an individual SKCM patient in the TCGA cohort, and the axes for expression of factors of interest or mutational load increase in value from the center of the plot. The cohort was split at the median for survival, with short-term survivors shown in red and long-term survivors shown in black. The circles are generally concentric, with long-term survivors demonstrating higher levels of CYT, mutational load, and (A) PD-L1, (B) PD-L2, or (C) PD-1 expression and short-term survivors demonstrating lower levels of each of these factors. PD-axis molecule expression levels and CYT track each other closely, whereas mutational density tends to be less aligned. (D) Exceptional patients are highlighted in yellow on this hive plot displaying the interrelationship between PD-L1, mutational load, and CYT. There is a patient (accession no. TCGA-EE-A29E, highlighted here by solid yellow line) with very high mutational load, low CYT, and low PD-L1 expression. Despite the high mutational burden, none were currently being recognized by the immune system at the time of specimen acquisition. On the opposite end of the spectrum is another patient (accession no. TCGA-D3-A2JB, also highlighted by solid yellow line), who shows one of the lowest mutational burdens in the cohort. However, the mutations that were seemingly immunogenic were actively being recognized by the immune system at the time of specimen acquisition, as the patient had a relatively high CYT infiltrate and level of PD-L1 expression.

