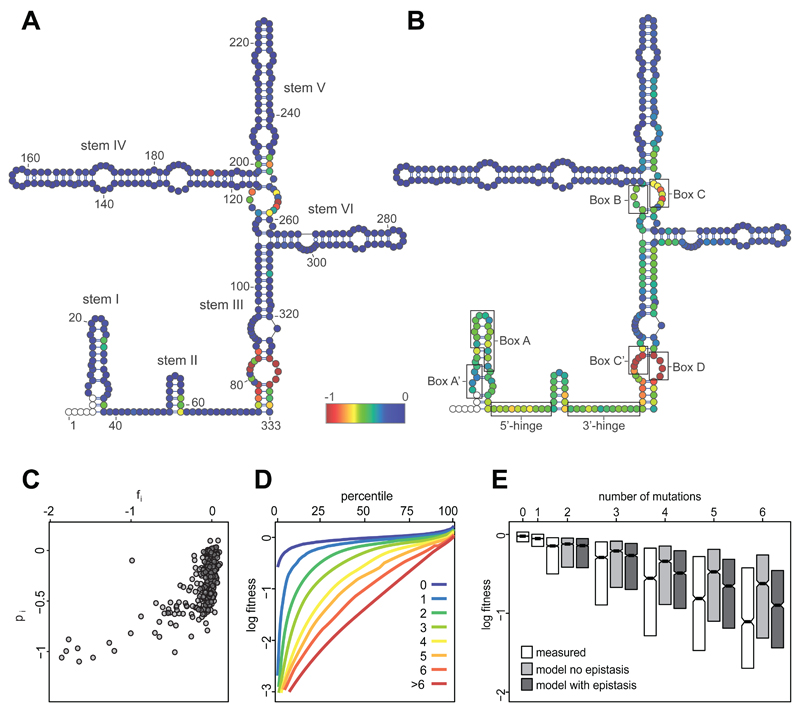
Figure 2. Distribution of fitness effects mapped to secondary structure.
A. The log fitness of single mutants at each position of U3 (fi) is represented according to the colour scale, from blue for no effect, to red for effects -1 and stronger; non-mutagenized positions are white. B. The population-average log fitness effect for each position in the background of multiple mutations (pi) (13). Evolutionarily conserved motifs are indicated on the secondary structure. C. Non-linear relationship between the fitness effects of single mutations in wild-type background (fi) and in mutated backgrounds (pi). D. Cumulative distributions of log fitness for mutants grouped by number of mutations per variant. E. Mean measured log fitness (white boxes) is always lower than expected in the absence of epistasis (grey boxes). Inclusion of epistasis improves the fit between the model and the data (dark grey boxes). The boxes show the median and inter-quartile ranges.

