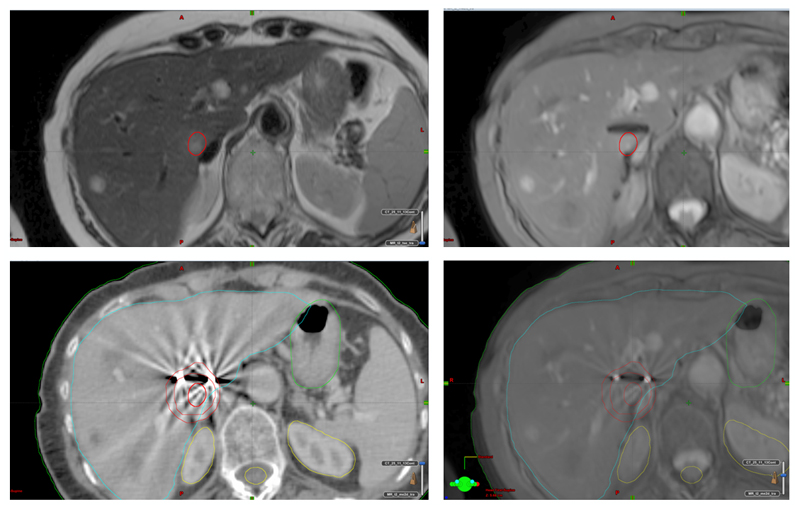
Figure 13.
T2-weighted (top left) and T2*-weighted (top right) MR liver images after insertion of markers for cyberknife stereotatic RT. T2W images allow delineation of the lesion (in red) but do not demonstrate the markers. T2*W images and the CT images (bottom left) allow visualisation of the markers, and therefore can be registered. The CTV is thus transferred to the CT images for RT planning. The combined final dataset (bottom right, created using Eclipse, Varian Medical Systems, Switzerland) shows the CTV outlined using the MRI dataset and the OARs outlined in the CT dataset.

