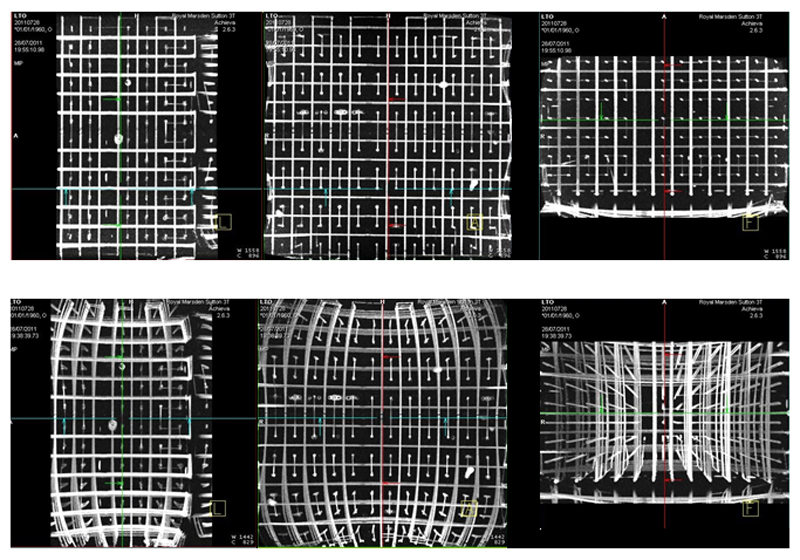
Figure 7.
Sagittal, Coronal and Transaxial Maximum Intensity Projections (MIPs) of images of the Linear Test Object described by Doran et al. (2005). The 3D datasets were acquired at 1.5T (Siemens Aera, Erlangen, Germany), using T1-weighted sequences normally used for RT planning. The maximum intensity projections (MPSs) on the bottom row show substantial distortions. The MIPS on top row were obtained after applying the built-in distortion correction software provided by the MRI manufacturer.

