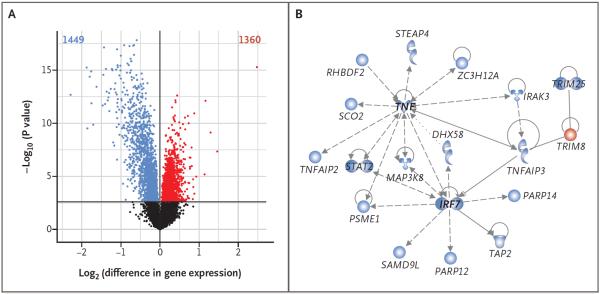
Figure 3. Gene-Expression Profiles in Peripheral-Blood Leukocytes from Amish and Hutterite Children.
In Panel A, a volcano plot shows differences in baseline gene expression in peripheral-blood leukocytes from Amish and Hutterite children. The x axis indicates the log2 differences in gene-expression level between groups, with larger positive values representing genes with higher expression in the Hutterites relative to the Amish (1360 genes, shown in red points) and larger negative values representing genes with higher expression in the Amish relative to the Hutterites (1449 genes, shown in blue points). The y axis shows the −log10 of the P values for each gene, with larger values indicating greater statistical significance. The solid horizontal line indicates the 1% false discovery rate. Black points represent genes from Amish and Hutterite cells for which there was no significant difference in gene expression. Differences in gene expression remain after the data for children with asthma or allergic sensitization were excluded (Figs. S6 and S7 in the Supplementary Appendix). Changes in gene expression between the two groups after correcting for differences in cell proportion are shown in Figure S4 in the Supplementary Appendix. In Panel B, a network of differentially expressed genes in untreated peripheral-blood leukocytes is shown. Genes shown in blue have increased expression in Amish children, and the gene shown in red has increased expression in Hutterite children. The gene shapes indicate the class of each gene's protein product (spirals denote enzymes, a v-shape denotes cytokines, conjoined circles denote a transcription regulator, hollow upside-down triangles denote kinases, cups denote transporters, and circles denote other products). Lines represent different biologic relationships (solid lines indicate direct interaction, dashed lines indirect interaction, arrows direction of activation, arrows with a horizontal line direction of activation and inhibition, and lines without arrows binding only).

