
Figure 2. YAP/TAZ phosphorylation in response to serum starvation.
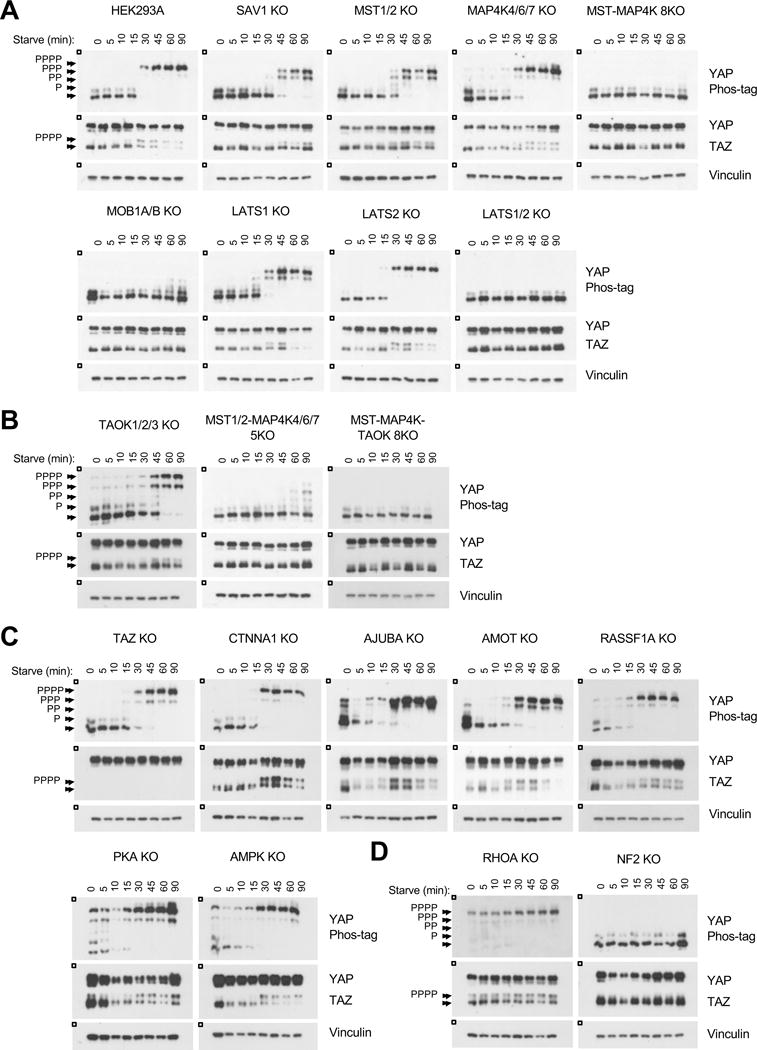
A–D. Immunoblots showing YAP/TAZ phosphorylation status following serum starvation. The HEK293A cells in A are the relevant control for all panels; the figure is subdivided for readability. See Figure S3 for quantification.