
Figure 3. Dysregulation of YAP/TAZ phosphorylation results in aberrant YAP/TAZ localization and transcriptional activity.
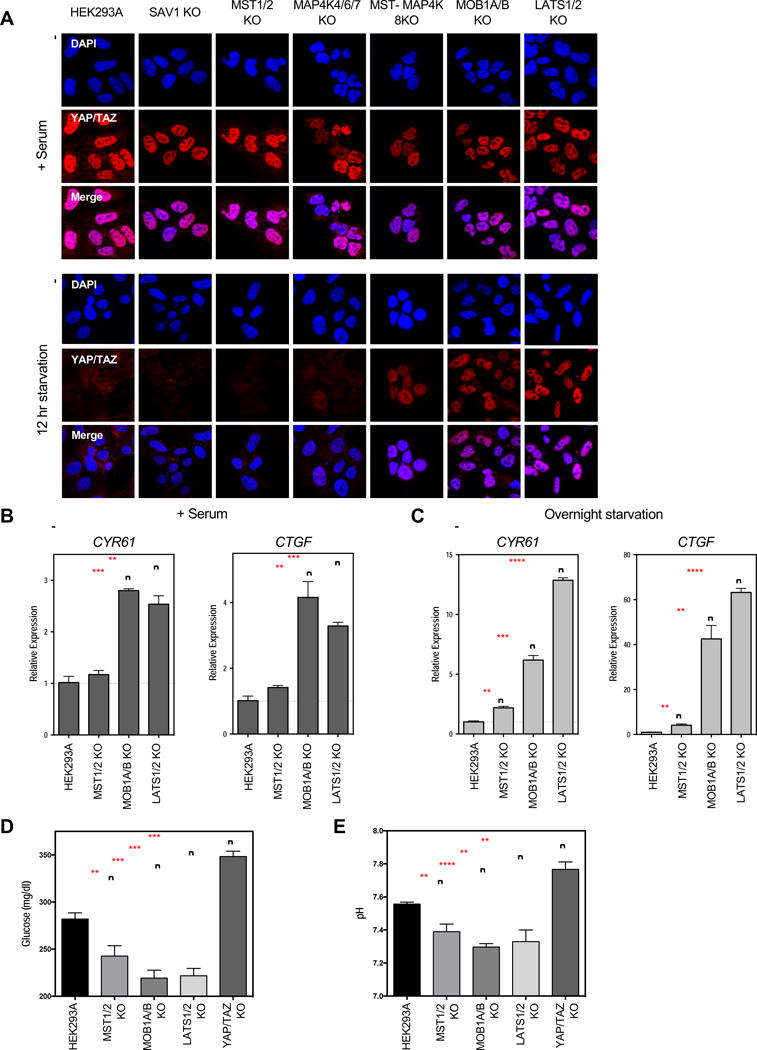
A. Immunofluorescence staining for YAP/TAZ (red) and DAPI (blue) in the presence of serum or following 12 hours of serum starvation. See Figure S4A for quantification. B and C. Relative expression of YAP/TAZ downstream target genes CYR61 and CTGF in the presence of serum (B), or following overnight serum starvation (C), as quantified by qPCR. Data represented as mean +/−S.D. D and E. Glucose levels (D) and pH (E) of the culture media following a 6 hour incubation under normal culture conditions. Data represented as mean +/− S.D.