Abstract
Background
Phase analysis of cardiac arrhythmias, particularly atrial fibrillation (AF), has gained interest due to the ability to detect organized stable drivers (rotors) and target them for therapy. However, the lack of methodology details in publications on the topic has resulted in ongoing debate over the phase mapping technique. By comparing phase maps and activation maps we examined advantages and limitations of phase mapping.
Methods and Results
7 subjects were enrolled. We generated phase maps and activation maps from ECGI-reconstructed epicardial unipolar electrograms (EGMs). For ventricular signals, phase was computed with: i) pseudo-empirical mode decomposition (pEMD) detrending, and ii) a novel Moving Average (MVG) detrending approach. For AF signals, MVG was modified to incorporate cycle length (CL) changes (MVG-DCL). Phase maps were visually analyzed to study phase singularity points and rotors. Results show that phase is sensitive to CL choice, a limitation that was addressed by the MVG-DCL algorithm. MVG-DCL was optimal for AF analysis. Phase maps helped to highlight high-curvature wavefronts and rotors. However, for some activation patterns phase generated non-rotational singularity points and false rotors.
Conclusions
Phase mapping computes singularity points and visually highlights rotors. As such, it can help to provide a clearer picture of the spatiotemporal activation characteristics during AF. However, it is advisable to incorporate EGM characteristics and the time-domain AT sequence in the analysis, to prevent misinterpretation and false rotor detection. Therefore, for mapping complex arrhythmias, a combined time-domain activation and phase mapping with variable CL appears to be the most reliable method.
Keywords: phase analysis, human, rotor, cardiac arrhythmia, mapping, atrial fibrillation, ventricular tachycardia, hilbert transform phase analysis
Journal Subject Terms: Arrhythmias, Atrial Fibrillation, Electrophysiology
Introduction
Characterization of spatiotemporal dynamics during cardiac fibrillation, particularly atrial fibrillation (AF), has been the subject of studies in many laboratories that have attempted to elucidate mechanisms and identify targets for therapy. This goal requires techniques, in addition to electrogram-based activation mapping, for determining the sequence of excitation and characterizing wavefront properties. Activation mapping, commonly used for determining the origin and pattern of excitation, assigns a specific time point on the unipolar electrogram (time of steepest negative deflection), as the marker of local activation. However, during fibrillation, information in electrograms is often ambiguous; the electrograms can contain multiple sharp deflections and, due to their low amplitude, they are prone to artifacts. Consequently, the electrogram is often transformed into the frequency domain. However, frequency domain mapping produces time-averaged frequency information over space, thereby losing the ability to track temporal variations of the signal. A third parameter that has been used to characterize a temporal signal is its instantaneous phase.1 Phase is a measure of where in its cycle of oscillation a signal is at a given point in time. Phase mapping computes oscillations in the signal over its entire duration, independent of its amplitude. Therefore, analysis of phase changes over space provides information on the patterns of organization (repetitive activity) and helps to assess their stability in time and space. This approach can be particularly useful during fibrillation. Phase mapping can help identify circulating wavefronts (rotors)1 that rotate about phase singularity points (core) comprised of unexcited but excitable tissue.2
Phase analysis of cardiac fibrillation and the concept of cardiac rotors and spiral waves were introduced by Winfree.3 The experimental evidence for rotors in cardiac tissue was reported by Davidenko.4 Gray5 applied this concept to optical action potential signals. A systematic procedure for tracking phase singularity points in a phase map was developed by Bray and Wikswo.6 Phase analysis was extended to study unipolar epicardial contact electrograms during human ventricular fibrillation1, 7 and AF.8, 9 In the clinical setting, phase analysis has been applied to human AF mapped with a 64-electrode basket catheter.10 In a different approach, it has been applied in conjunction with non-invasive electrocardiographic mapping (ECM).11 The rotor dynamics determined with these two approaches were different, possibly due to methodology differences. Unfortunately, details of phase computation have never been reported by either group. Both approaches identified phase singularity points (core of a rotor) as a target for ablation. However, rotor-based ablation remains a topic of discussion.12-14
Computation of phase involves the transformation of the signal to the phase domain by selecting a specific cycle length (CL) from the temporal signal. The phase changes are then tracked over this CL. Several transformation techniques have been utilized, of which the Hilbert Transform (HT) was shown to be the most robust. The two clinical studies referenced above10, 11 have used the HT. However, an important requirement for using HT is that the signal amplitude is equalized about its center of rotation.1 Bray et al6 developed a pseudo-Empirical Mode Decomposition (pEMD) method to condition optical signals during fibrillation prior to applying HT. This approach involved detrending each signal using the average of its maximum and minimum envelopes, computed over a sliding window of fixed duration. However, this method may not be suitable for unipolar electrograms as it assumes that the important information of the signal is contained only at its extrema. Kuklik et al9 used a sinusoidal recomposition method to detrend atrial unipolar contact electrograms with good results, but their approach assumed local stability of CL over a period of time.
Our goals for this project were: i) to introduce and assess a novel signal detrending approach, that is less dependent on EGM morphology and fluctuations, and can account for spatial and temporal CL variability during fibrillation; ii) to perform phase analysis on ventricular and atrial unipolar electrograms reconstructed by ECGI and; iii) to shed light on the advantages and limitations of phase mapping and its relation to activation mapping, thereby addressing issues that can affect phase computation and interpretation. This project is not intended to study the mechanisms of fibrillation, but to use selective examples in order to evaluate the properties of phase mapping.
Methods
Before analyzing fibrillatory rhythms, we generated phase maps in non-fibrillatory rhythms, to better understand the effects of cycle length and detrending on phase analysis. The following 7 subjects were studied, providing examples of various rhythms: two patients with ventricular tachycardia (VT; focal and reentrant), a patient with typical right atrial flutter, a paroxysmal AF patient during normal sinus rhythm, and three persistent AF patients. All participants underwent ECGI at Washington University in St. Louis (WUSTL)/ Barnes Jewish Hospital. All subjects signed a written informed consent and all protocols were reviewed and approved by the Human Research Protection Office at WUSTL.
Signal processing
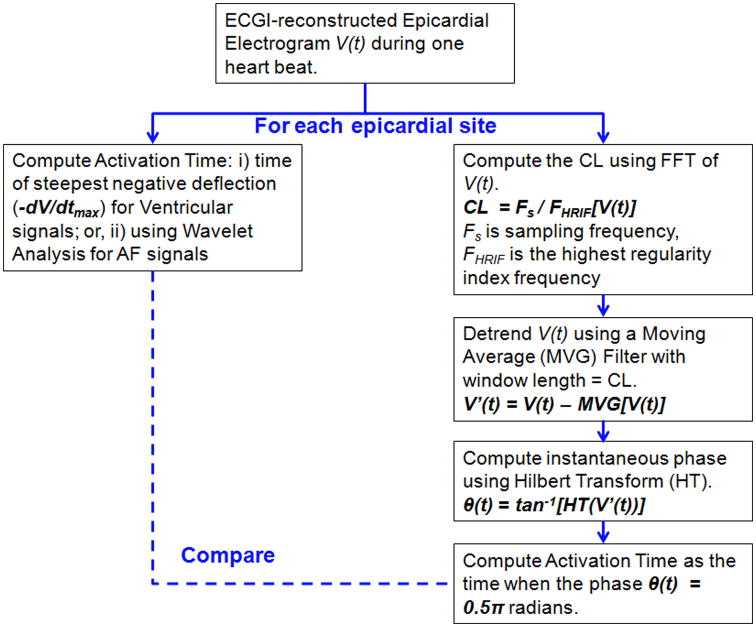
The ECGI methodology, developed in our laboratory, is described in previous publications15-18 and briefly in the Supplement. Epicardial potentials and unipolar electrograms are reconstructed from the measured body surface potential and patient-specific heart-torso geometry. These data can be used to generate activation and repolarization maps in the time domain. The data could also be analyzed to create phase maps in the phase domain. In the present study we compare the two forms of analysis. Figure 1 shows the workflow for phase mapping and for comparing it with time-domain activation mapping. Time-domain activation mapping methods are summarized in the Supplement; Supplemental Figure S1 illustrates how activation time (AT) is computed using the wavelet-transform algorithm16. Phase mapping methodology is described below.
Figure 1.
Flow diagram for analysis of ECGI epicardial electrograms. V indicates Voltage; CL, Cycle Length; FFT, Fast Fourier Transform. See text for other definitions.
High-curvature wavefronts were classified as follows:
Complete Rotors: wavefronts completing at least one 360-degree rotation about a stationary or meandering singularity point (rotor core, comprised of unexcited but excitable tissue).
Incomplete or Partial Rotors: high curvature waves that do not complete a full rotation due to wave break or collision with other wavefronts.
Reentry: wavefronts rotating around an inexcitable (anatomic) barrier.
Phase Mapping
The time dependence of phase θ of an electrogram represents its repetition over time; it is computed by:
| (1) |
where V(t) is the unipolar epicardial electrogram; VT(t) is a phase-shifted version of V(t); and tan-1 indicates the inverse of the tangent function. In this study, HT was used to obtain VT(t), as it has been shown to be the most robust1 and therefore the most commonly used technique.
Input Signal Conditioning (Detrending)
We first evaluated the pEMD method6 of detrending. We applied this technique to reconstructed unipolar epicardial electrograms during monomorphic VT (with the following desirable properties: high signal-to-noise ratio, propagation pattern known from invasive mapping during a prior study17, and a fixed CL) and compared the resulting phase progression with the time-domain activation isochrones.
We also applied and evaluated the Moving Average (MVG) method19, which involves detrending each signal Vn(t) by subtracting the average of the entire signal over a sliding window of specific length:
| (2) |
where n is number of windows which cover the entire signal.
We compared the effects of these two detrending methods on phase computation of epicardial signals during VT.
During a more complex arrhythmia such as AF, there is spatial variability in CL throughout the atria (Supplemental Figure S5), which limits the use of methods that rely on a single CL for all locations. For the purpose of phase analysis of atrial signals we introduced a modification of the MVG detrending method to estimate the CL at each epicardial node independent of its neighbors, so that the phase computation is unaffected by spatial CL fluctuations. Complex arrhythmias such as AF may not only have spatial variability in CL across the atria, but also multiple CLs instead of a single dominant CL at each location. This is reflected in the power spectrum of the signal, which contains multiple peaks. Some of these peaks can also result from noise. Therefore, it is difficult to compute reliably a single dominant CL (or equivalently single DF) during AF.
For an accurate phase computation during AF, the majority of CLs (or frequencies) present in the signal at each atrial region should be included in the analysis. We compute fHRIF (highest regularity index frequency) as the upper limit of frequencies that contribute 90% of the total signal power between 3-50 Hz. Using 90% of the power spectrum ensures that all significant frequency contributions are included. The moving average (MVG) filter has a slow roll-off in the frequency domain19 and retains frequencies up to twice the input frequency (fHRIF in our case). Therefore, we divide fHRIF by 2 in order to attenuate high frequencies above 90% of the spectrum, thereby eliminating noise contamination of the signal. Supplement Figure S2 illustrates how phase is computed using the HRIF algorithm.
We then use fHRIF, computed over an R-R interval, to obtain the normalized sampling frequency (NSF) of the signal at each node as:
| (3) |
where fs is the sampling frequency =2 kHz.
For each epicardial electrogram, the average of the signal was computed over a sliding window with a window length = 1/NSF (calculated in (3)). This average was subtracted from the original signal V(t) to obtain the detrended signal V′(t). We used this modified technique for AF signals.
In all approaches, the instantaneous phase θ was computed using:
| (4) |
where HT is the Hilbert Transform of the detrended signal V′(t). Equation (4) can be expressed as:
| (5) |
Note that this is the standard formulation, commonly used and found in toolboxes.
Identification of Phase Singularity Points
The instantaneous phase was plotted over time for all the sites on the epicardium. This resulted in a dynamic phase movie showing the spatial phase distribution for each instance of time within one activation cycle. The phase values were color coded and surrogates of the depolarization and repolarization wavefronts were computed from the isophase values equal to –π (blue) and π (red) respectively. From this movie, a phase singularity point was determined as a site where all the phases converge and the surrounding elements exhibit a continuous progression of phase that is equal to ±2π.20
The dynamic phase movie was visually analyzed to determine the phase progression of high-curvature wavefronts on the epicardium.
Activation Time Map derived from Phase
For any given time instance, the epicardial phase map shows the phase of each epicardial signal by assigning it a value between –π and π radians. The time instance when the phase transitions from π to –π (sharp discontinuities in the bottom row of supplemental figure S2), indicates the beginning of the next phase cycle. The wavefront AT corresponds to 0.5π radians in the phase plot, as explained in section 1c of the Online Supplement. When phase is computed using (5), the time instances of phase discontinuities occur at the minima of the signal (supplemental figure S2). For each epicardial site, a matrix containing time series of 1 and 0 was created, with value of 1 indicating time instances at which that site was at phase = 0.5π radians (phase-derived AT). A dynamic activation movie was made for all sites on the epicardium for the duration of the analysis. This movie showed the propagation of the epicardial activation wavefront, computed from phase, during an arrhythmia. It was compared to the epicardial activation wavefront computed directly from activation times on the electrograms.
Results
The effects of input signal conditioning and CL on phase analysis are presented in the Supplement (Supplemental Figures S3 and S4).
Application of the Dynamic CL MVG Method for Atrial Arrhythmias
Supplement Figure S5 compares the atrial CL distribution computed using the HRIF algorithm (Equation 3) in two patients during one beat of atrial flutter (panel A) and AF (panel B) respectively. The CL distribution across the atria is fairly uniform in the case of atrial flutter, with a narrow range of values (200 ms to 290 ms) demonstrating greater organization than AF and a unique CL. However during AF, the CL values exhibit spatial heterogeneity (shorter CL in LA compared to RA) with a wider range of values (80 ms to 200 ms). Since CL exhibits spatial as well as beat-to-beat (not shown) variability during AF, use of a fixed CL value can lead to errors in phase computation. Movie 3 (Supplement) shows an example of a phase map constructed during 245 ms of human AF activity using fixed CL (left) and dynamic CL (right). The dynamic CL phase map highlights a singularity point meandering over the posterior LA and a high curvature wavefront rotating in the counterclockwise direction. The rotor is not clearly seen in the fixed CL phase map. In addition, the phase progression (left) is less stable when computed using fixed CL.
Comparison of Phase-derived Activation and Wavelet-based Activation during Persistent AF
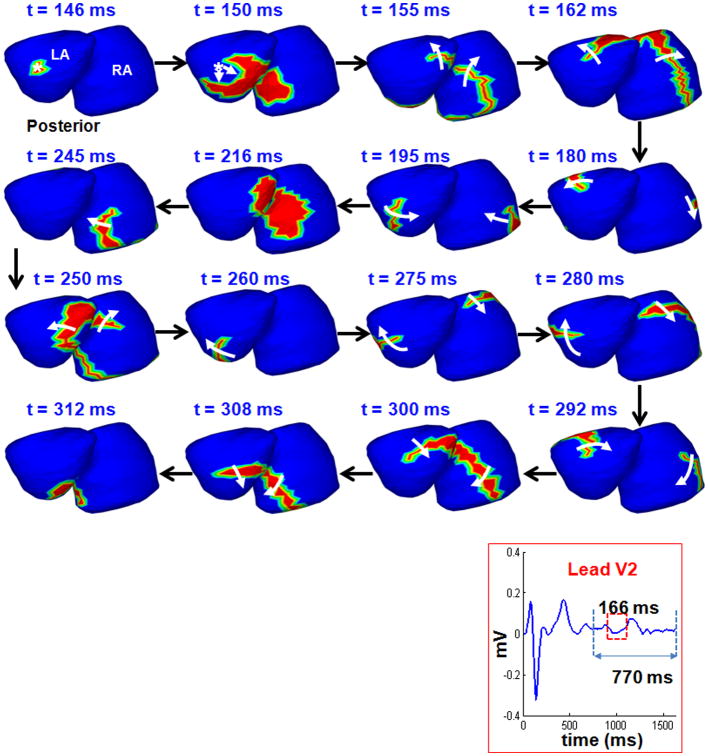
Figure 2 shows the time-domain bi-atrial epicardial activation sequence during AF, reconstructed by ECGI with wavelet analysis. The corresponding lead V2 of the body surface ECG indicates the interval chosen for analysis. The maps show the activation fronts (red) for a selected duration of 166 ms (red rectangle on the ECG) using 16 frames. White arrows show direction of propagation. Black arrows indicate transition between frames. Epicardial activation initiates from a breakthrough (rS morphology of the local electrogram) near the right inferior pulmonary vein on the posterior LA (t=145 ms). The wavefront propagates towards the RIPV (t=150 ms) and breaks along the septum, resulting in two branches. The superior branch activates the LA as it rotates counterclockwise over the LA. Across the septum, the wavefront propagates along the lateral wall of the RA in a clockwise direction. The two wavefronts return to the septal region where they collide (t=216 ms) and terminate. A new wavefront, continuing from the crista terminalis propagates along the floor of the RA (t=245 ms) towards the septum. This wave breaks on the septum, resulting in two branches, propagating in a clockwise direction over the LA and RA. The two branches join near the septum (t=312 ms). The activation maps show complex patterns and multiple mechanisms (breakthrough, wave breaks and collisions, rotating wavefronts) during 166 ms of persistent AF in a patient.
Figure 2.
Time-domain activation maps of persistent AF. Epicardial activation sequence, computed over 502 sites in LA and 502 sites in RA, shown in posterior view during AF. Lead V2 of the body surface ECG indicates the chosen interval. The maps show the sequence of activation for 166 ms (red rectangle on the ECG lead V2) using 16 frames. Red region represents the wavefront; white arrows indicate direction of wavefront propagation. Black arrows show transition between frames. The t value indicates the time of each frame relative to the beginning of the analyzed interval.
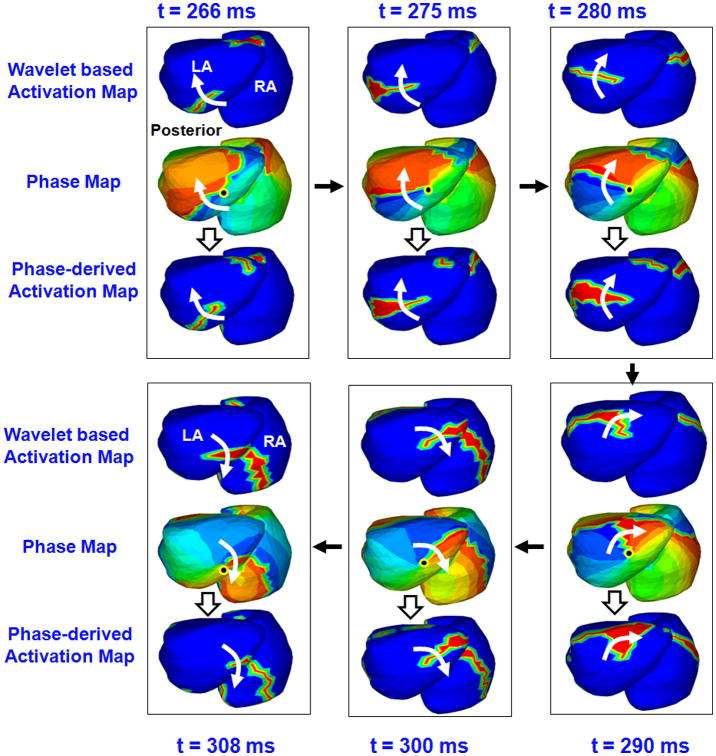
Figure 3 shows maps for 45 ms of atrial activity selected from Figure 2 (with a slightly different view to better show the rotor in phase map). The top map in each frame shows the time- domain activation sequence (t=266 ms to t= 308 ms of figure 2). The sequence shows a wavefront propagating along the posterolateral LA with clockwise rotation, which then meets another wavefront from RA on the septum (t = 308 ms). The corresponding phase maps (middle map in each frame) were obtained using MVG detrending with Dynamic CL and HT for 502 sites on the LA and 502 sites on the RA. The maps show that the overall progression of phase (blue-red boundary) is consistent with the time-domain activation pattern. Additionally, the phase maps indicate the presence of a phase singularity point on the inferior LA (black dot). Phase progression over the LA shows a clockwise rotation about the singularity point that does not complete 360 degrees (a “partial rotor”). During the same time period, the phase progression on the RA shows a high curvature wavefront along the lateral wall. This wavefront merges with the LA partial rotor along the septum. The bottom map in each frame shows the activation maps derived from the phase maps. The phase-derived activation maps are very consistent with the time-domain activation maps for each time instance. Although the rotational wavefront can be inferred from the activation maps (top and bottom rows), the colors of the phase map emphasize the phase singularity point and the curvature of the rotor more clearly (middle rows).
Figure 3.
Phase mapping of AF in the patient of Figure 2. ECGI-reconstructed phase maps during 45 ms of atrial activity selected from Figure 2, shown in a slightly different view. Each frame shows activity for one time instance. The t values indicate the corresponding time. The black arrows indicate the sequence of frames. Top Maps in Each Frame: Time-domain activation maps, generated from 502 EGMs on the LA and on the RA using wavelet-transform. Middle Maps: Corresponding phase maps during the same interval. Black dot indicates singularity point. Bottom Maps: Phase-derived activation maps for the same time instances.
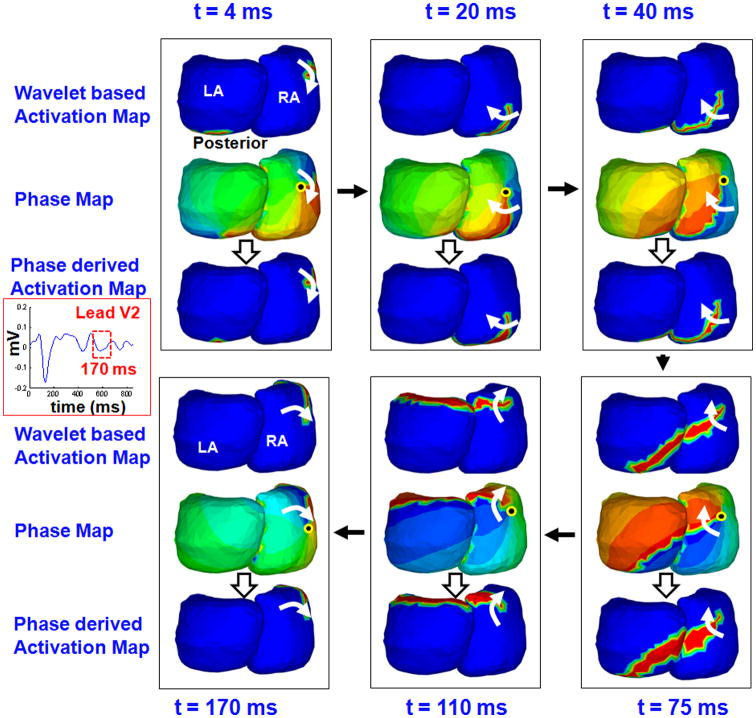
Figure 4 shows 170 ms of atrial activity for another patient with persistent AF. Time-domain activation (top maps), corresponding phase progression (middle maps), and phase-derived activation (bottom maps) are shown for six time instances (frames). The time-domain activation maps show that the activation wavefront (red) propagates along the posterolateral wall of the RA and proceeds to activate the posterior LA across the septum (t = 4 to 40 ms). It evolves into a broad wavefront that encompasses both atria and rotates in the clockwise direction (t = 75 ms and 110 ms). At t = 170 ms, activation returns to the initiation site to complete the circuit. The phase maps (middle rows of each column) show the corresponding phase progression (blue-red boundary) across the atria during the same time period. In addition, the phase maps show the presence of a phase singularity point (black dot) in the posterior RA and a rotor (white arrows) that rotates about it in the clockwise direction, completing one full rotation (360 degrees). The singularity point meanders over the posterior RA. The ECGI panoramic mapping captures the overall dynamics of the wavefront as it spans both atria. The phase-derived activation sequence (bottom rows of each column) is consistent with the wavelet-based activation sequence (top rows). The phase map visually highlights the location of the singularity point (where all colors touch) and the rotor is visualized more clearly than in the wavelet-based activation map and the phase-derived activation map.
Figure 4.
Phase mapping of persistent AF in another patient. ECGI-reconstructed maps (posterior view) show 170 ms of atrial activity for a different patient than in Figure 2, with persistent AF. Top Maps: Time-domain activation maps obtained using wavelet transform. Middle Maps: Corresponding phase maps. Bottom Maps: Activation maps derived from phase.
Misinterpretation of Phase Maps
Phase maps highlight curvature of the activation wavefront. As demonstrated in the examples above, this property helps to identify rotors. However, it can also introduce bias towards rotor detection; examples are provided below.
Normal Sinus Rhythm
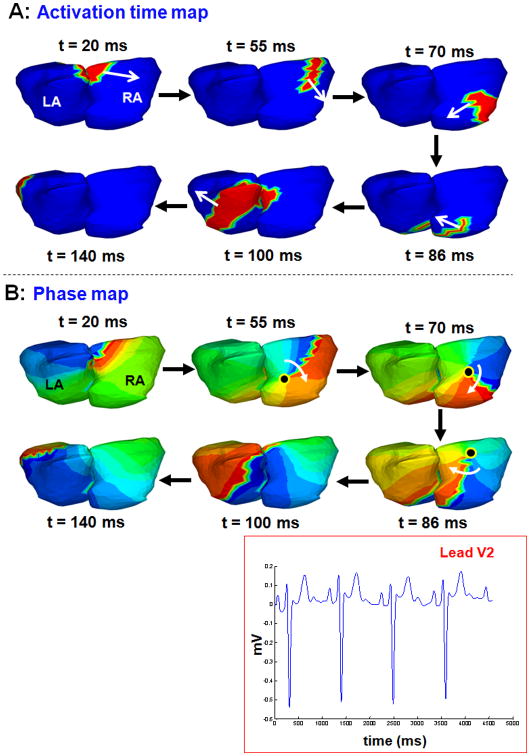
Figure 5 shows the time-domain activation map (panel A) and corresponding phase map (panel B) for six time instances during one beat of sinus rhythm atrial activation. Lead V2 for four consecutive beats shows the underlying normal rhythm. The activation maps show a normal activation pattern with the wavefront originating from the sinus node, curving along posterior RA (t = 20 ms), activating the RA (t= 55 to 86 ms) followed by LA activation (t=100 ms). The LA appendage is the latest region to activate (t=140 ms). This curvature of the activation front along the RA wall is also shown in the phase map. However, snapshots of the phase map at time instances 55 ms, 70 ms and 86 ms, identify a phase singularity point (black dot) and a rotational phase pattern (white arrow) about it. The existence of the phase singularity point implicates a rotor in the RA, although the activation wavefront does not become a rotor. Therefore, interpretation of these phase maps in isolation, without referring to the activation map, could lead to false identification of a rotor.
Figure 5.
Phase map generates a posterior RA rotor during sinus rhythm. A: Time-domain activation maps for six time instances during sinus rhythm. B: Phase map shows a phase singularity point (black dot) in the posterior RA (t = 55 ms, t = 70ms and t=86 ms) and a rotational phase pattern (white arrow) about it.
Lines of Block and Sequential Activation
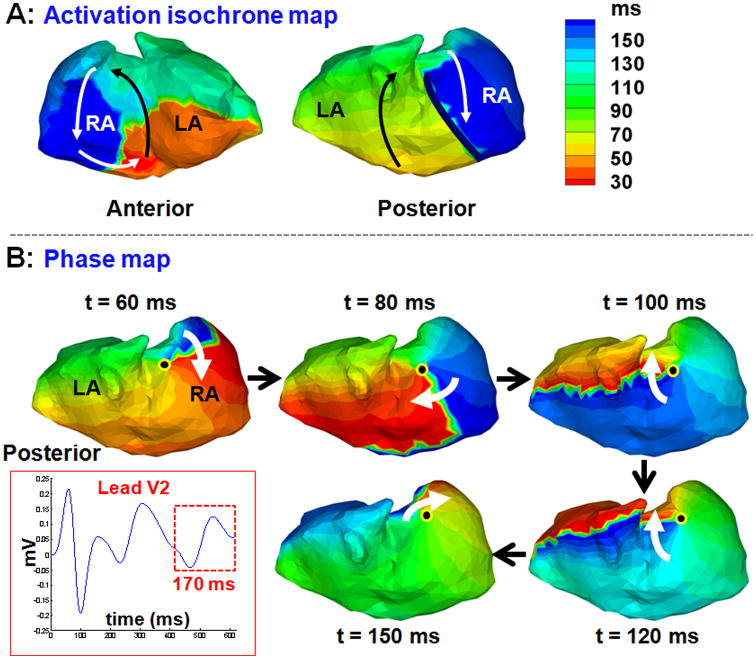
Figure 6 shows the activation isochrones map during one cycle of typical atrial flutter (panel A; two views). The map shows a typical counter clockwise macroreentrant circuit about the cavotricuspid region (anterior view). This circuit was the driver of the flutter as verified by EP lab results and successful ablation of the cavotricuspid isthmus. This is consistent with the ECGI-reconstructed activation pattern reported previously (Figure 5b, anterior view)15. Posterior activation occurs sequentially on two sides of a line of block (thick black line) by two activation fronts, one propagating superiorly (green) and the other inferiorly (blue). However, the phase map (panel B) shows a complete rotor (white arrow) rotating about a singularity point (black dot) with a clockwise chirality on the posterior RA. This example demonstrates that sequential activation about a line of block can be interpreted erroneously as a rotor based on the phase map.
Figure 6.
Sequential activation about a line of block during atrial flutter can appear as a rotor in the phase map. A: Activation isochrones maps (two views) during one cycle of typical RA flutter. The macroreentry circuit that drives the flutter is seen in the anterior view (arrows). There is a line of block in the posterior RA (thick black line) and sequential activation about it. B: This sequential activation appears as a rotor (white arrow) on the posterior RA in the corresponding phase map.
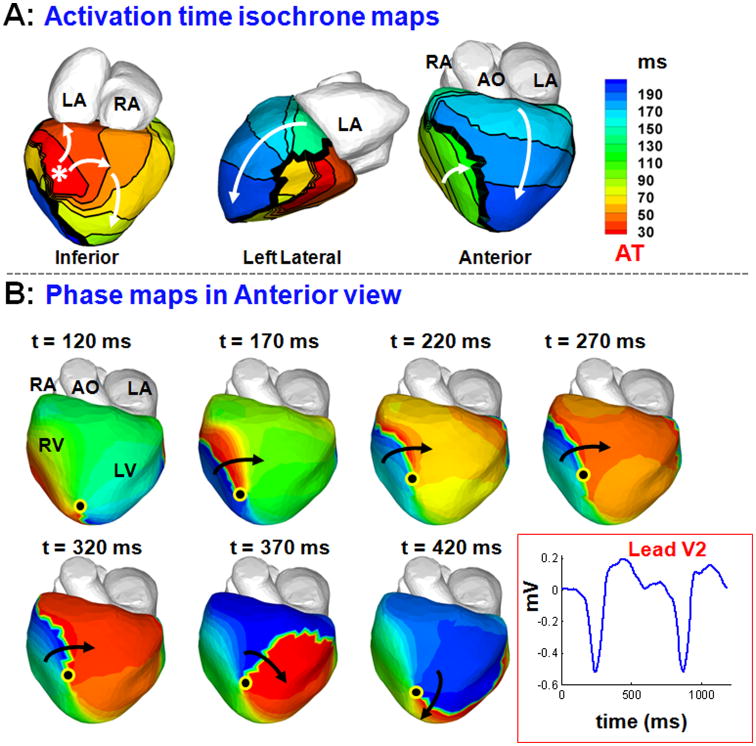
Figure 7 also demonstrates that sequential activation of regions separated by a line of block can be interpreted as a rotor based on the corresponding phase map. Maps in panel A show epicardial activation isochrones during one beat of VT. The asterisk indicates the earliest site of epicardial activation, from which two branching wavefronts emanate. The inferior branch proceeds to activate the right ventricle (RV, green) and encounters a line of block (thick black line in anterior view). The superior branch proceeds anteriorly towards the left ventricle (LV) base to activate the LV from base to apex (blue). Thus, the two regions flanking the line of block are activated sequentially by two different wavefronts. Panel B shows the corresponding phase maps, which show a rotor on the anterior RV, rotating around a singularity point near the RV apex with clockwise chirality (black arrow). The location of the singularity point is in the region of conduction block, which was associated with low voltage during invasive EP mapping, indicating the presence of a scar and an anatomical barrier. This example reiterates that phase maps can be misinterpreted to indicate the presence of rotors, when in fact activation is from multiple wavefronts that activate neighboring regions sequentially.
Figure 7.
Sequential activation about a line of block during VT can appear as a rotor in the phase map. A: Maps show epicardial activation isochrones during VT. The activation map shows a line of block in anterior RV (thick black line) and sequential activation of its two sides by two wavefronts - one coming from the lateral RV (green) and another from the LV base (blue). B: The corresponding phase maps show a phase singularity point (black dot) and clockwise rotor in the RV apex, in disagreement with the activation map in A.
Discussion
In this study, we devised a novel application of MVG in phase mapping of cardiac arrhythmias. This approach is particularly useful for mapping complex activation patterns during fibrillation, because it is not affected by transient fluctuations in EGM morphology or amplitude, including noise. In order to evaluate phase analysis, we needed an independent method to compute activation time (AT). During fibrillation, the commonly used method of determining AT using -dV/dtmax is prone to error due to the multiple deflections in the signal and the low signal to noise ratio (SNR). The wavelet-transform algorithm used in this study (and in past studies16) overcomes the limitations of the common AT computation approach by reducing the effect of noise and resolving multiple AT in the signal. In this study, all time-domain AT computations during fibrillation were conducted using the wavelet algorithm.
While the time-domain AT map is essential for understanding the overall wavefront propagation patterns, it is difficult to determine from this map the precise point about which a wavefront rotates. This can be easily achieved with phase computation, which determines singularity points based on a precise mathematical definition. Phase mapping also highlights wavefront curvature and organized activity during fibrillation. Due to these properties, phase mapping can be a valuable additional analysis method. However, as shown in the paper, phase mapping results require careful interpretation because it can sometimes introduce false rotors. Therefore, it should be used in combination with a robust time-domain AT mapping method for characterizing arrhythmia mechanisms during fibrillation.
We demonstrate that phase computation depends strongly on correct determination of CL. The correct choice of CL is more critical for pEMD detrending (Figure S3, panel B) than for MVG detrending. This is to be expected because the pEMD method (originally developed for optically-recorded action potentials) involves detrending the input signal by interpolating between local maxima and minima for a given window, and the estimation of the window length depends on accurate knowledge of CL. Sensitivity analysis was conducted to test the CL dependency of the pEMD and MVG algorithms and the results are shown in the Supplement Figures S6 and S7, respectively. Figure S6 demonstrates that pEMD is more affected by changes in CL and requires a priori knowledge of the correct CL to yield correct results. Supplement Figures S9 and S10 show that at incorrect CL, the algorithm has the propensity to miscalculate maxima or minima, which results in incorrect morphology of the detrended signal and hence erroneous phase computation. In contrast, the MVG method uses the entire signal information (not only its extrema) by averaging the signal over a window; it does not require maxima/minima determination. Consequently, phase progression computed using the MVG method corresponded better with the activation pattern over a wide range of CL (Figures S7, S12-S14).
Although the MVG-based phase computation is more robust over a wider range of CL, if an erroneous CL is chosen, the phase maps show drastically different and incorrect patterns with multiple colliding rotors, as shown in Figure S4 Panel B. It is not always possible to determine a single CL value, especially during complex arrhythmias such as AF in which CL changes spatially and temporally (the spatial variability of CL is shown in Supplemental Figure S5). To overcome this difficulty, we formulated a dynamic CL approach, which automates CL computation for each epicardial site independent of its neighbors, using a high regularity index frequency (fHRIF) parameter. The phase for each electrogram is computed using its own fHRIF. In contrast, DF employs a single value for all electrogram locations, disregarding the spatial dependence of frequency and CL. Also, computation of DF is unreliable for regions with multiple peaks in the frequency spectrum, a common occurrence during fibrillation. Not surprisingly, DF has been shown to poorly correlate with AF CL21. Phase maps computed with MVG detrending with a dynamic CL correlated well with the time-domain activation maps, as shown in figures 3 and 4.
Singularity Points and Rotors
Phase analysis was performed using 502 epicardial electrograms per chamber, with an average distance of 5-10 mm between neighboring nodes. The high resolution mapping inherent in ECGI methodology allowed for detection of high-curvature wavefronts and rotors without the need for interpolation. This approach is different from Narayan et al.,22 who used linear interpolation of the phase state between 64 basket electrodes due to insufficient coverage. In our study, the panoramic bi-atrial mapping allowed for determination of wavefront dynamics across the atria. The results show that the location of a singularity point (or “core”) was not fixed in AF during the mapping period, causing the rotor to meander over the mapped surface. This behavior is consistent with the findings from simulations23 as well as human mapping studies.11
Incomplete, “Wannabe” and False Rotors
The presence of a phase singularity point was not always accompanied by a complete rotor. For instance, in Figure 3, the phase maps during AF (middle rows) show a LA phase singularity point and a rotational pattern around it. However, the rotating wavefront merged with another wavefront from the RA near the inferior septum and did not complete a 360 degree rotation. The rotational wavefront could be termed an “incomplete” or “partial” rotor.
The phase map of sinus rhythm (Figure 5) displayed a phase singularity point and rotational pattern around it at certain time instances (Figure 5, panel B). If viewed in isolation, this pattern of the phase map could be interpreted incorrectly to represent a rotor.
Activation isochrone maps for a typical right atrial flutter (Figure 6A) reveal a line of block and sequential activation in the posterior RA. The phase map (panel B) highlights a high-curvature wavefront pivoting about a singularity point on this line of block. This wavefront may be misinterpreted as a rotor, and ablation at this phase-singularity point is unlikely to terminate typical right atrial flutter. It fits the definition of a “wannabe” rotor coined by Lee et al.24, who used high-density epicardial mapping during AF. They reported wavefronts emanating from focal sources, which pivoted around the end of a line of block, but failed to complete a rotation due to wave break or collision. The location of the phase singularity point occurred at one of the edges of the line of block. This is because at the edge, there is a continuous progression of phase from -π to π in the neighboring nodes, which fulfills the requirement for formation of a phase singularity point. Figure 7 also demonstrates that sequential activation about a line of block can generate a false rotor in the phase map. These two examples, one atrial and one ventricular, affirm the prediction by Berenfeld et al.12 that the phase algorithm has a propensity to introduce rotors by combining wavefronts that activate a region sequentially. The examples further demonstrate that if interpretations were made solely based on phase maps, without examining the underlying electrograms or the time-domain activation sequence, false rotors could be detected and inappropriately targeted for ablation. Therefore, in such cases it is important to use additional non-phase information to validate the results of phase mapping before labeling a region as an ablation target. In the application of phase analysis to the current datasets, we have not encountered an example where phase analysis obscured an existing rotor that was captured by activation mapping. In fact, phase analysis highlights the curvature of the activation front and therefore can visually emphasize existing rotors.
Limitations
Atrial signals during fibrillation typically have a low amplitude and a low signal-to-noise ratio. The presence of noise can generate artifacts in the phase computation because the detrending algorithm amplifies all oscillations of the recorded signal. In this study, we used a low pass filter with cutoff frequency of 12 Hz to mitigate this problem. This value was chosen based on our time-domain analysis.
We applied a signal detrending algorithm (MVG detrending) and modified it to improve the accuracy of phase computation in situations where CL varies in time and space. We tested this method against a widely-used algorithm - the pEMD detrending. Although a broader comparison, involving other detrending techniques, could be suggested, we feel that it is outside the scope of the current project. Our goal was to apply phase analysis to unipolar electrograms, compare it with activation mapping and thereby understand the relationship between the two. To achieve this goal, we applied MVG detrending with dynamic CL. This method provided optimal results, as demonstrated by correlation between phase maps and activation maps.
We worked with a limited, yet well-defined set of data, obtained from intact human hearts using detailed panoramic mapping. Although phase mapping is currently being used in AF ablation, the methodology and properties of electrogram-based phase mapping have not been established nor adequately described. This study aims to fill this gap. The selected examples were chosen to demonstrate the properties of phase, present associated problems and suggest possible solutions. A statistical evaluation of phase mapping, as a detector of rotors, is a different (albeit related) objective that requires a separate study with a different study design. A meaningful statistical analysis requires a much larger study, in a large cohort of patients and is outside the scope and objective of this paper.
Conclusions
Phase maps can provide important information on the spatiotemporal characteristics of complex arrhythmias by computing phase singularity points and highlighting existing rotors. However, given the inherent nature of the phase algorithm to emphasize rotational wavefronts, a thorough analysis and careful interpretation must incorporate electrogram characteristics and the time-domain activation sequence to avoid detection and targeting of false rotors and singularity points. Therefore, for mapping complex arrhythmias, a wavelet-based time-domain activation combined with phase mapping with variable CL appears to be a more reliable method for identifying true rotational activity.
Supplementary Material
What is Known
Phase mapping of atrial fibrillation (AF) has suggested that stable rotors sustain human AF.
However, details of some electrogram-based phase mapping methods have not been completely described and rotor-based ablation has achieved mixed outcomes in terminating AF.
what the Study Adds
This study develops a robust phase mapping method for analyzing cardiac electrograms in the presence of spatio-temporal cycle length variations as occur during AF, generating maps that are mostly consistent with activation-time maps.
Phase mapping highlights rotational wave fronts (rotors) and determines their center of rotation (singularity point) using a precise mathematical definition, properties that can facilitate analysis of wavefront dynamics during complex arrhythmias.
However, phase mapping has the propensity to introduce false rotors during complex activation patterns, such as wavefront propagation about a line of block, suggesting that a combined approach using both time-domain activation maps and phase maps would improve accuracy.
Acknowledgments
We thank Mr. Michael Harrod for expert assistance with the CT scans. We also appreciate greatly the helpful discussions with Junjie Zhang and Christopher Andrews during many meetings of the ECGI research team in the Rudy lab.
Sources of Funding: This study was supported by NIH–NHLBI grants R01-HL-033343 and R01-HL-049054 (to Y. Rudy) and by the Washington University Institute of Clinical and Translational Sciences grant UL1 TR000448 from the National Center for Advancing Translational Sciences (NCATS) of the NIH. Dr. Yoram Rudy is the Fred Saigh Distinguished Professor at Washington University.
Footnotes
Disclosures: Y. Rudy co-chairs the scientific advisory board of and receives royalties from CardioInsight Technologies (CIT). CIT does not support any research conducted in Dr. Rudy's laboratory.
References
- 1.Umapathy K, Nair K, Masse S, Krishnan S, Rogers J, Nash MP, Nanthakumar K. Phase mapping of cardiac fibrillation. Circ Arrhythm Electrophysiol. 2010;3:105–114. doi: 10.1161/CIRCEP.110.853804. [DOI] [PubMed] [Google Scholar]
- 2.Gray RA, Jalife J, Panfilov AV, Baxter WT, Cabo C, Davidenko JM, Pertsov AM. Mechanisms of cardiac fibrillation. Science. 1995;270:1222–1223. author reply 1224-1225. [PubMed] [Google Scholar]
- 3.Winfree A. When time breaks down. Princeton, NJ: Princeton University Press; 1987. [Google Scholar]
- 4.Davidenko JM, Kent PF, Chialvo DR, Michaels DC, Jalife J. Sustained vortex-like waves in normal isolated ventricular muscle. Proc Natl Acad Sci U S A. 1990;87:8785–8789. doi: 10.1073/pnas.87.22.8785. [DOI] [PMC free article] [PubMed] [Google Scholar]
- 5.Gray RA, Pertsov AM, Jalife J. Spatial and temporal organization during cardiac fibrillation. Nature. 1998;392:75–78. doi: 10.1038/32164. [DOI] [PubMed] [Google Scholar]
- 6.Bray MA, Wikswo JP. Considerations in phase plane analysis for nonstationary reentrant cardiac behavior. Phys Rev E Stat Nonlin Soft Matter Phys. 2002;65:051902. doi: 10.1103/PhysRevE.65.051902. [DOI] [PubMed] [Google Scholar]
- 7.Nash MP, Mourad A, Clayton RH, Sutton PM, Bradley CP, Hayward M, Paterson DJ, Taggart P. Evidence for multiple mechanisms in human ventricular fibrillation. Circulation. 2006;114:536–542. doi: 10.1161/CIRCULATIONAHA.105.602870. [DOI] [PubMed] [Google Scholar]
- 8.Shors SM, Sahakian AV, Sih HJ, Swiryn S. A method for determining high-resolution activation time delays in unipolar cardiac mapping. IEEE Trans Biomed Eng. 1996;43:1192–1196. doi: 10.1109/10.544343. [DOI] [PubMed] [Google Scholar]
- 9.Kuklik P, Zeemering S, Maesen B, Maessen J, Crijns HJ, Verheule S, Ganesan AN, Schotten U. Reconstruction of instantaneous phase of unipolar atrial contact electrogram using a concept of sinusoidal recomposition and hilbert transform. IEEE Trans Biomed Eng. 2015;62:296–302. doi: 10.1109/TBME.2014.2350029. [DOI] [PubMed] [Google Scholar]
- 10.Narayan SM, Krummen DE, Shivkumar K, Clopton P, Rappel WJ, Miller JM. Treatment of atrial fibrillation by the ablation of localized sources: Confirm (conventional ablation for atrial fibrillation with or without focal impulse and rotor modulation) trial. J Am Coll Cardiol. 2012;60:628–636. doi: 10.1016/j.jacc.2012.05.022. [DOI] [PMC free article] [PubMed] [Google Scholar]
- 11.Haissaguerre M, Hocini M, Shah AJ, Derval N, Sacher F, Jais P, Dubois R. Noninvasive panoramic mapping of human atrial fibrillation mechanisms: A feasibility report. J Cardiovasc Electrophysiol. 2013;24:711–717. doi: 10.1111/jce.12075. [DOI] [PubMed] [Google Scholar]
- 12.Berenfeld O, Oral H. The quest for rotors in atrial fibrillation: Different nets catch different fishes. Heart Rhythm. 2012;9:1440–1441. doi: 10.1016/j.hrthm.2012.04.029. [DOI] [PMC free article] [PubMed] [Google Scholar]
- 13.Mohanty S, Gianni C, Mohanty P, Halbfass P, Metz T, Trivedi C, Deneke T, Tomassoni G, Bai R, Al-Ahmad A, Bailey S, Burkhardt JD, Gallinghouse GJ, Horton R, Hranitzky PM, Sanchez JE, Di Biase L, Natale A. Impact of rotor ablation in non-paroxysmal af patients: Results from a randomized trial (oasis) J Am Coll Cardiol. 2016;68:274–282. doi: 10.1016/j.jacc.2016.04.015. [DOI] [PubMed] [Google Scholar]
- 14.Buch E, Share M, Tung R, Benharash P, Sharma P, Koneru J, Mandapati R, Ellenbogen KA, Shivkumar K. Long-term clinical outcomes of focal impulse and rotor modulation for treatment of atrial fibrillation: A multicenter experience. Heart Rhythm. 2016;13:636–641. doi: 10.1016/j.hrthm.2015.10.031. [DOI] [PMC free article] [PubMed] [Google Scholar]
- 15.Ramanathan C, Ghanem RN, Jia P, Ryu K, Rudy Y. Noninvasive electrocardiographic imaging for cardiac electrophysiology and arrhythmia. Nat Med. 2004;10:422–428. doi: 10.1038/nm1011. [DOI] [PMC free article] [PubMed] [Google Scholar]
- 16.Cuculich PS, Wang Y, Lindsay BD, Faddis MN, Schuessler RB, Damiano RJ, Jr, Li L, Rudy Y. Noninvasive characterization of epicardial activation in humans with diverse atrial fibrillation patterns. Circulation. 2010;122:1364–1372. doi: 10.1161/CIRCULATIONAHA.110.945709. [DOI] [PMC free article] [PubMed] [Google Scholar]
- 17.Wang Y, Cuculich PS, Zhang J, Desouza KA, Vijayakumar R, Chen J, Faddis MN, Lindsay BD, Smith TW, Rudy Y. Noninvasive electroanatomic mapping of human ventricular arrhythmias with electrocardiographic imaging. Sci Transl Med. 2011;3:98ra84. doi: 10.1126/scitranslmed.3002152. [DOI] [PMC free article] [PubMed] [Google Scholar]
- 18.Rudy Y. Chapter 70: Noninvasive electrocardiographic imaging (ecgi) of arrhythmogenic substrates and ventricular arrhythmias in patients Appendix: Methodology considerations and validation of ecgi in the rudy laboratory. In: Zipes DP, Stevenson W, editors. Cardiac electrophysiology: From cell to bedside. 7th. Elsevier; 2016. [Google Scholar]
- 19.Smith SW. Digital signal processing. A practical guide for engineers and scientists. 2003 [Google Scholar]
- 20.Pandit SV, Jalife J. Rotors and the dynamics of cardiac fibrillation. Circ Res. 2013;112:849–862. doi: 10.1161/CIRCRESAHA.111.300158. [DOI] [PMC free article] [PubMed] [Google Scholar]
- 21.Elvan A, Linnenbank AC, van Bemmel MW, Misier AR, Delnoy PP, Beukema WP, de Bakker JM. Dominant frequency of atrial fibrillation correlates poorly with atrial fibrillation cycle length. Circ Arrhythm Electrophysiol. 2009;2:634–644. doi: 10.1161/CIRCEP.108.843284. [DOI] [PubMed] [Google Scholar]
- 22.Narayan SM, Krummen DE, Clopton P, Shivkumar K, Miller JM. Direct or coincidental elimination of stable rotors or focal sources may explain successful atrial fibrillation ablation: On-treatment analysis of the confirm trial (conventional ablation for af with or without focal impulse and rotor modulation) J Am Coll Cardiol. 2013;62:138–147. doi: 10.1016/j.jacc.2013.03.021. [DOI] [PMC free article] [PubMed] [Google Scholar]
- 23.Davidenko JM, Pertsov AV, Salomonsz R, Baxter W, Jalife J. Stationary and drifting spiral waves of excitation in isolated cardiac muscle. Nature. 1992;355:349–351. doi: 10.1038/355349a0. [DOI] [PubMed] [Google Scholar]
- 24.Lee S, Sahadevan J, Khrestian CM, Cakulev I, Markowitz A, Waldo AL. Simultaneous biatrial high-density (510-512 electrodes) epicardial mapping of persistent and long-standing persistent atrial fibrillation in patients: New insights into the mechanism of its maintenance. Circulation. 2015;132:2108–2117. doi: 10.1161/CIRCULATIONAHA.115.017007. [DOI] [PMC free article] [PubMed] [Google Scholar]
Associated Data
This section collects any data citations, data availability statements, or supplementary materials included in this article.


