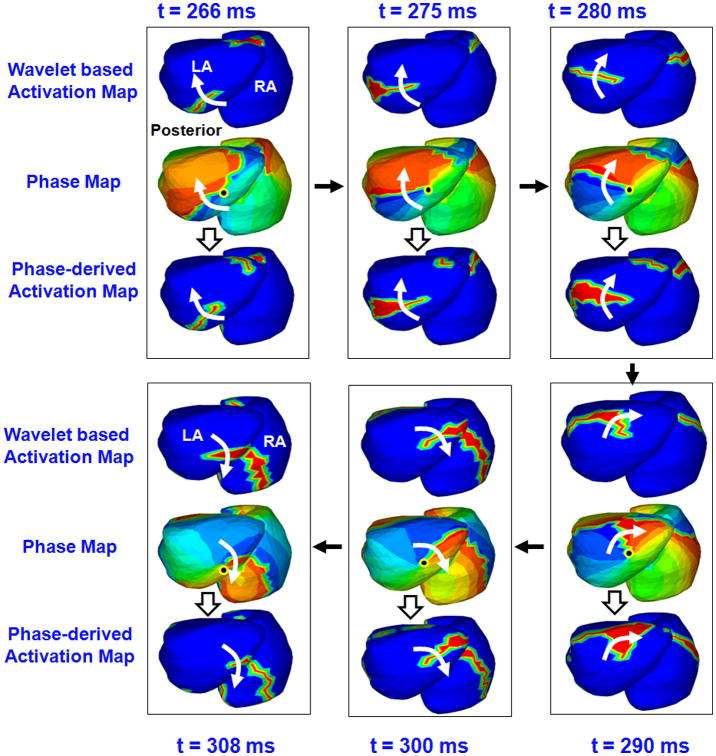
Figure 3.
Phase mapping of AF in the patient of Figure 2. ECGI-reconstructed phase maps during 45 ms of atrial activity selected from Figure 2, shown in a slightly different view. Each frame shows activity for one time instance. The t values indicate the corresponding time. The black arrows indicate the sequence of frames. Top Maps in Each Frame: Time-domain activation maps, generated from 502 EGMs on the LA and on the RA using wavelet-transform. Middle Maps: Corresponding phase maps during the same interval. Black dot indicates singularity point. Bottom Maps: Phase-derived activation maps for the same time instances.

