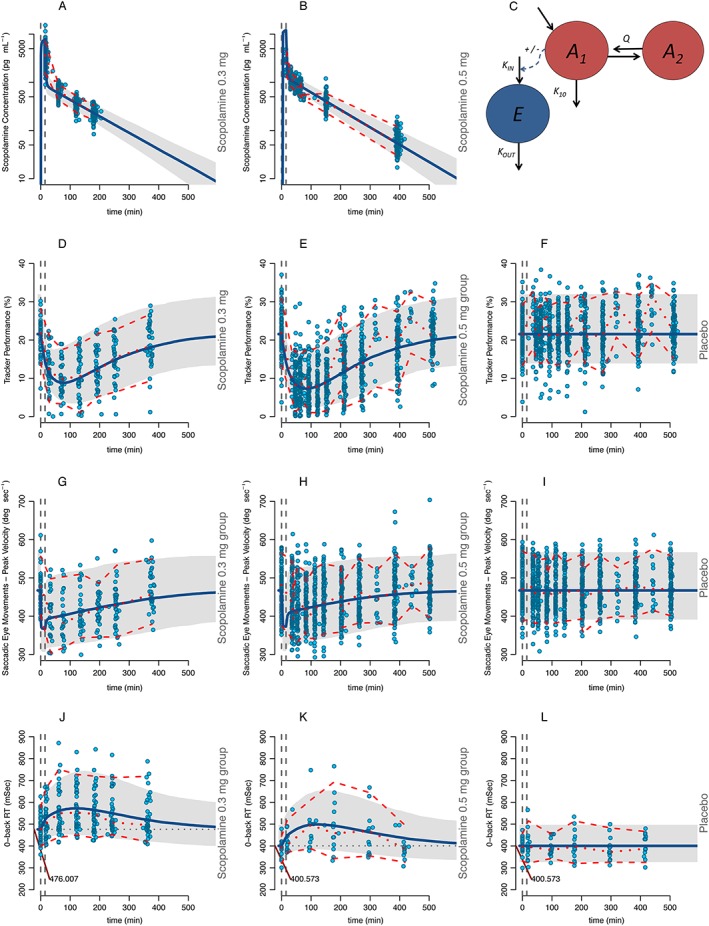
Figure 1.

Scopolamine pharmacokinetics and pharmacodynamic effects. The column on the left represents the scopolamine 0.3 mg group, the middle column the scopolamine 0.5 mg group and the column on the right the placebo group. Figures 1A and 1B represent the plasma scopolamine concentrations. Figure 1C is the schematic representation of the model where the red circles represent the central (A1) and peripheral (A2) PK compartments and the blue circle (E) the effect (PD) compartment. Figures 1D, 1E and 1F display the adaptive tracker test, Figures 1G, 1H and 1I the peak velocity of the saccadic eye movements test, Figures 1J, 1K and 1L the Reaction Time of the 0‐Back test. The continuous blue line represents the model population predicted values per group and the grey area represents the 95% prediction interval. Circles represent the observations. The middle red discontinuous line represents the median of the observations with the upper and lower 95% confidence intervals. Dotted, vertical grey lines represent the start and stop times of the scopolamine infusion. The differences in baseline‐estimated values are indicated by a red line and the population value (when applicable). Simulations were performed with 1000 subjects
