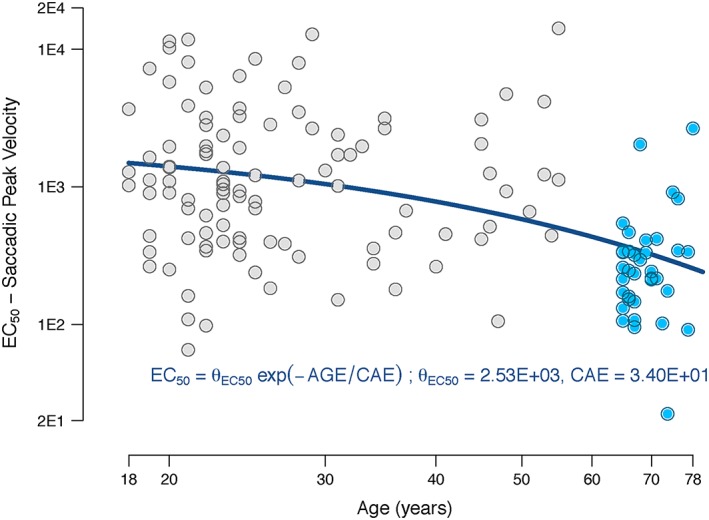
Figure 3.

Relationship between EC 50 and age in the saccadic eye movements peak velocity. The estimated EC 50 value is represented by the blue (younger adults) and grey (older adults) circles plotted against age. The continuous line represents the function with the population values for EC 50
