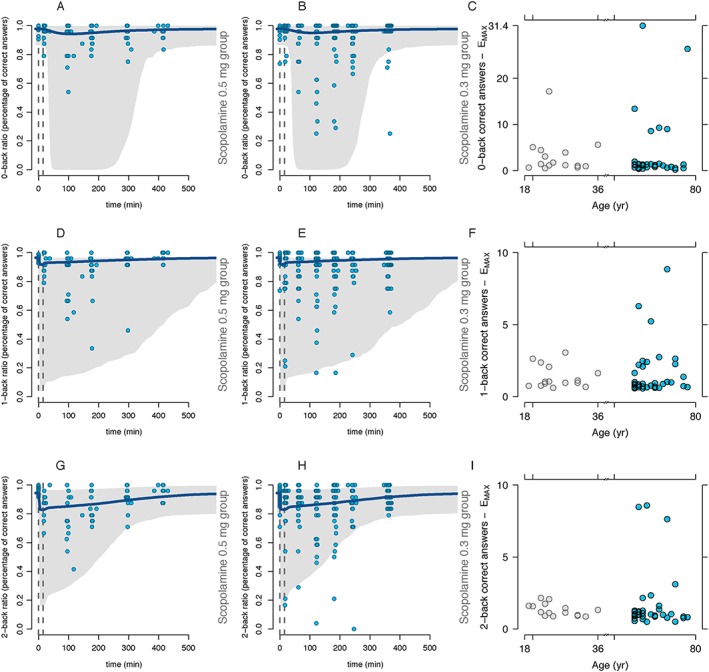
Figure 4.

Scopolamine pharmacodynamic effects in the N‐back (number of correct answers). The column on the left represents the scopolamine 0.3 mg group (Figures 4A, 4D and 4G), the middle column the scopolamine 0.5 mg group (Figures 4B, 4E and 4H) and the column on the right the estimated E MAX (Figure 4C, 4F and 4I). The first row represents the 0‐back, the second row the 1‐back and the last row the 2‐back percentage of correct answers in the paradigm. The continuous blue line represents the model population predicted values per group and the grey area represents the 95% prediction interval. Circles represent the actual observations. Dotted, vertical gray lines represent the start and stop times of the scopolamine infusion. Simulations were performed with 1000 subjects
