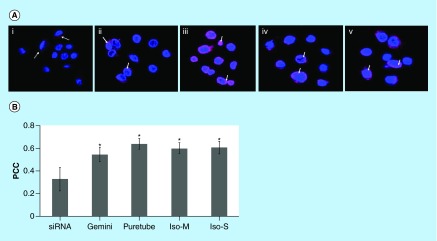
Figure 6. . Uptake of G-single wall carbon nanotubes-siRNA complexes into purified nuclei.
(A) Nuclei were imaged using confocal microscopy following 24 h of incubation with (i) free siRNA, (ii) gemini-siRNA, (iii) G-Puretubes-siRNA, (iv) G-Isonanotubes-M-siRNA and (v) G-Isonanotubes-S-siRNA complexes. Dashed arrows represent siRNA (red) outside of nucleus and bold arrows represent colocalization of siRNA into the nucleus (pink). (B) Colocalization analyses in confocal z-stack images of nuclei using Huygens Pro software. PCC was calculated for at least five images per treatment and the average calculated values for each condition were plotted on the histogram (error bars represent ±SD). *Significant in comparison with free-siRNA, p value < 0.05. Bar: 10 μm for all micrographs.
Gemini: Gemini surfactant; IsoM: Isonanotubes metallic; IsoS: Isonanotubes semiconducting; PCC: Pearson's correlation coefficient.

