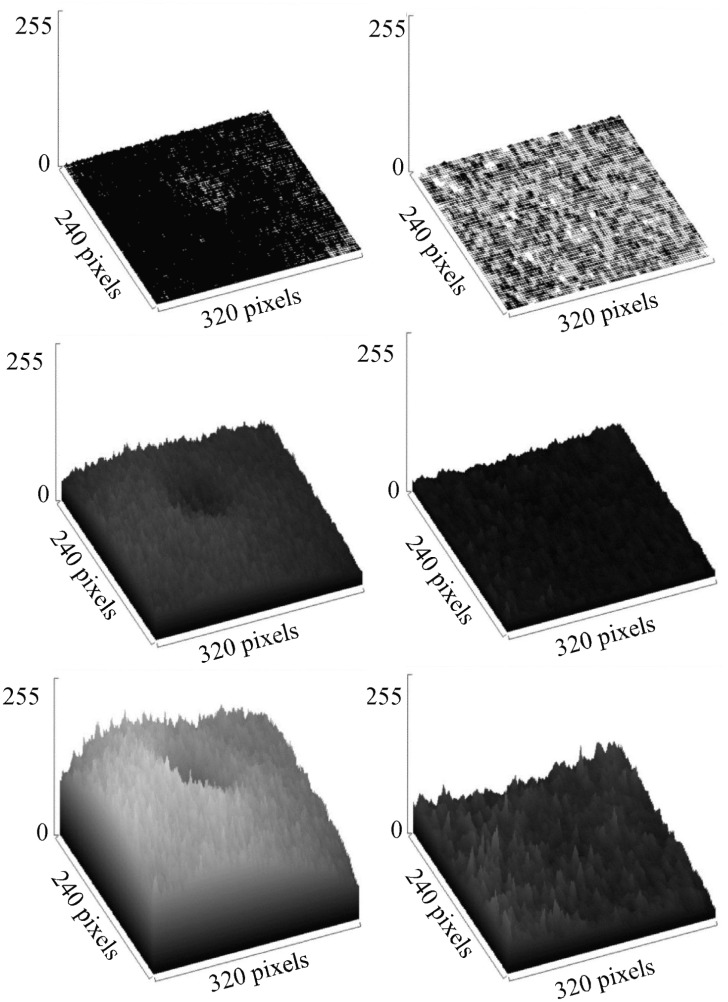
Fig 9. Surface plots comparing a video with high Biospeckle activity and a video with low Biospeckle activity.
(a),(b) and (c) Surface plots of the images that were obtained from a video with parasites and benznidazole 0.3125μg/mL at 1min, calculated with ImageJ and Eq (3) in Fig 5, with 2, 10 and 30 frames (1, 9 and 29 image differences) included in the calculation, respectively. (d),(e) and (f) Surface plots of the images that were obtained from a video without parasites and benznidazole 0.3125μg/mL at 1min, calculated with ImageJ and Eq (3) in Fig 5, with 2, 10 and 30 frames (1, 9 and 29 image differences), included in the calculation, respectively.

