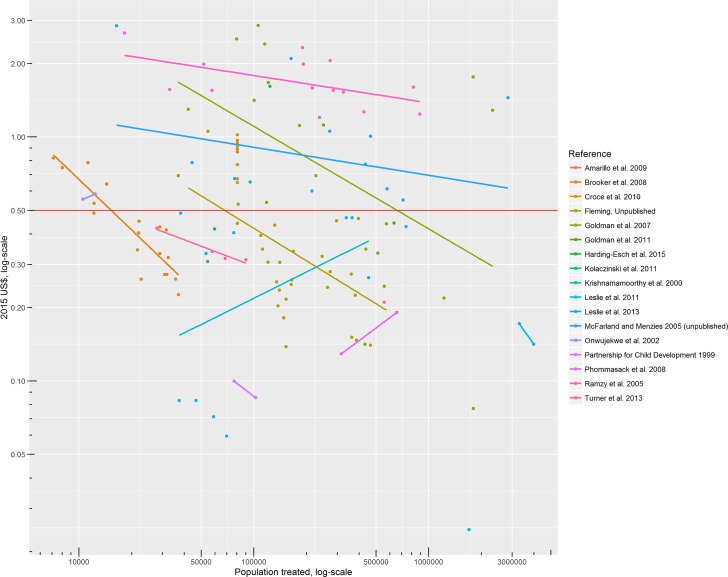
Fig 3. Economic unit costs (excluding volunteer time) and population treated, by study (across years, sites and comparators).
Dots represent individual study results, and lines represent the least squares line of best fit for studies with more than two results. The horizontal line at US$ 0.50 marks the oft-cited unit cost typically used in advocacy.

