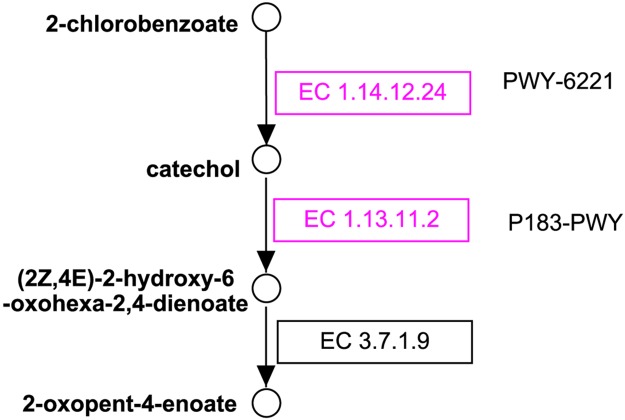
Fig 4. The 2-chlorobenzoate degradation pathway.
Circles represent compounds, and boxes (with EC numbers) represent enzymes. Enzymes with MS/MS data support are highlighted in purple. The figure was prepared using PathVisio [54] based on the MetaCyc’s diagrams of pathways PWY-6221 and P183-PWY.

