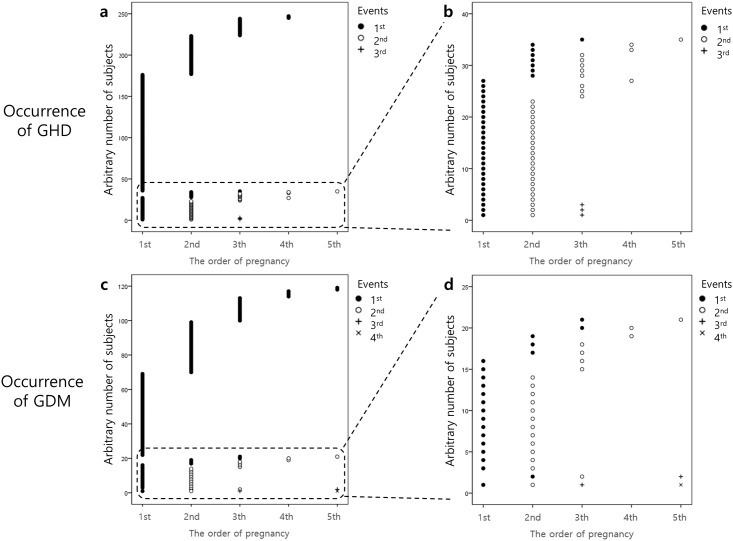
Fig 4. Distribution of the occurrence of GHD or GDM according to the order of pregnancy.
(A) The x-axis denotes the order of pregnancy. The y-axis indicates the arbitrary numbers of subjects. Every number matches each patient with GHD. To better demonstrate the distribution of the occurrence of GHD, subjects with more occurrences and subjects with earlier occurrence were placed at lower arbitrary numbers. (B) A magnified graph from the dashed-line rectangle in (A). (C), (D) Similarly, distribution of the occurrence of GDM according to the order of pregnancy.

