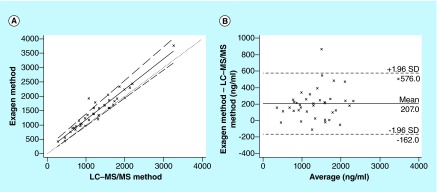
Figure 5. . Analysis of patient sample with current method and LC–MS/MS method.
(A) Passing–Bablok regression analysis between the new method and the LC–MS/MS method for 37 whole blood samples from systemic lupus erythematosus patients treated with hydroxychloroquine. The solid and dashed lines indicate the regression line and CI for the regression line, respectively. (B) Bland–Altman analysis between the new method and the LC–MS/MS method for 37 whole blood samples from systemic lupus erythematosus patients treated with hydroxychloroquine. The solid line indicates the mean difference between the methods.

